Amcor is engaged in developing and producing packaging for food, beverage, pharmaceutical, medical, home and personal-care, and other products. Co.'s reportable segments are: Flexibles and Rigid Packaging. Co.'s Flexibles Segment develops and supplies flexible packaging. The Flexibles Segment is a supplier of plastic, aluminum, and fiber based flexible packaging. Co.'s Rigid Packaging Segment manufactures rigid packaging containers and related products in the Americas. Co.'s sales are made through a variety of distribution channels, but through its direct sales force. Sales offices and plants are located throughout Europe, North America, Latin America, Africa, and Asia-Pacific regions.
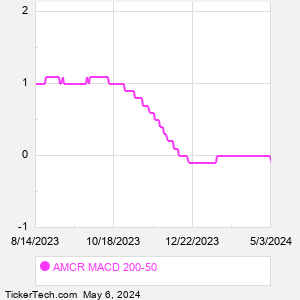
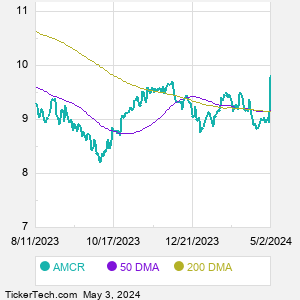
When researching a stock like Amcor, many investors are the most familiar with Fundamental Analysis — looking at a company's balance sheet, earnings, revenues, and what's happening in that company's underlying business. Investors who use Fundamental Analysis to identify good stocks to buy or sell can also benefit from AMCR Technical Analysis to help find a good entry or exit point. Technical Analysis is blind to the fundamentals and looks only at the trading data for AMCR stock — the real life supply and demand for the stock over time — and examines that data in different ways. One of those ways is to calculate a Simpe Moving Average ("SMA") by looking back a certain number of days. One of the most popular "longer look-backs" is the AMCR 200 day moving average ("AMCR 200 DMA"), while one of the most popular "shorter look-backs" is the AMCR 50 day moving average ("AMCR 50 DMA"). A chart showing both of these popular moving averages is shown on this page for Amcor. Comparing two moving averages against each other can be a useful visualization tool: by calculating the difference between the AMCR 200 DMA and the AMCR 50 DMA, we get a moving average convergence divergence indicator ("AMCR MACD"). The AMCR MACD chart, in conjunction with the chart of the moving averages, basically helps in visualizing how the moving averages are showing convergence (moving closer together), or divergence (moving farther apart). |