APA is a holding company. Through its subsidiaries, Co. is an energy company that explores for, develops, and produces natural gas, crude oil, and natural gas liquids. Co.'s upstream business has exploration and production operations in three geographic areas: the U.S., Egypt, and offshore the U.K. in the North Sea. Co. also has exploration and appraisal operations ongoing in Suriname, as well as interests in other international locations. Co.'s midstream business is operated by its subsidiary, Altus Midstream Company, through its subsidiary, Altus Midstream LP (collectively, Altus). Altus owns, develops, and operates a midstream energy asset network in the Permian Basin of West Texas.
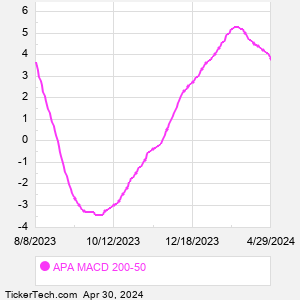
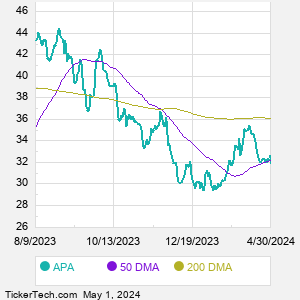
When researching a stock like Apache, many investors are the most familiar with Fundamental Analysis — looking at a company's balance sheet, earnings, revenues, and what's happening in that company's underlying business. Investors who use Fundamental Analysis to identify good stocks to buy or sell can also benefit from APA Technical Analysis to help find a good entry or exit point. Technical Analysis is blind to the fundamentals and looks only at the trading data for APA stock — the real life supply and demand for the stock over time — and examines that data in different ways. One of those ways is to calculate a Simpe Moving Average ("SMA") by looking back a certain number of days. One of the most popular "longer look-backs" is the APA 200 day moving average ("APA 200 DMA"), while one of the most popular "shorter look-backs" is the APA 50 day moving average ("APA 50 DMA"). A chart showing both of these popular moving averages is shown on this page for Apache. Comparing two moving averages against each other can be a useful visualization tool: by calculating the difference between the APA 200 DMA and the APA 50 DMA, we get a moving average convergence divergence indicator ("APA MACD"). The APA MACD chart, in conjunction with the chart of the moving averages, basically helps in visualizing how the moving averages are showing convergence (moving closer together), or divergence (moving farther apart). |