AvalonBay Communities is a real estate investment trust. Co. develops, redevelops, acquires, owns and operates multifamily apartment communities in New England, the New York/New Jersey metro area, the Mid-Atlantic, the Pacific Northwest, and Northern and Southern California, as well as in its expansion markets of Raleigh-Durham and Charlotte, NC, Southeast Florida, Dallas and Austin, TX, and Denver, CO. Co. operate its apartment communities under four primary brands, Avalon, AVA, eaves by Avalon and its Kanso brand.
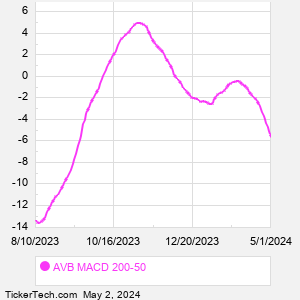
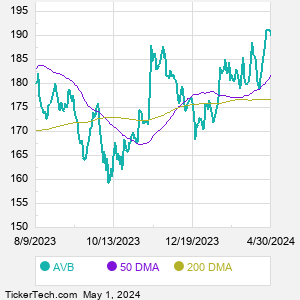
When researching a stock like AvalonBay Communities, many investors are the most familiar with Fundamental Analysis — looking at a company's balance sheet, earnings, revenues, and what's happening in that company's underlying business. Investors who use Fundamental Analysis to identify good stocks to buy or sell can also benefit from AVB Technical Analysis to help find a good entry or exit point. Technical Analysis is blind to the fundamentals and looks only at the trading data for AVB stock — the real life supply and demand for the stock over time — and examines that data in different ways. One of those ways is to calculate a Simpe Moving Average ("SMA") by looking back a certain number of days. One of the most popular "longer look-backs" is the AVB 200 day moving average ("AVB 200 DMA"), while one of the most popular "shorter look-backs" is the AVB 50 day moving average ("AVB 50 DMA"). A chart showing both of these popular moving averages is shown on this page for AvalonBay Communities. Comparing two moving averages against each other can be a useful visualization tool: by calculating the difference between the AVB 200 DMA and the AVB 50 DMA, we get a moving average convergence divergence indicator ("AVB MACD"). The AVB MACD chart, in conjunction with the chart of the moving averages, basically helps in visualizing how the moving averages are showing convergence (moving closer together), or divergence (moving farther apart). |