AutoZone is a retailer and distributor of automotive replacement parts and accessories in the Americas. Co. operates stores in the U.S., Mexico and Brazil. Each store carries a product line for cars, sport utility vehicles, vans and light duty trucks, including new and remanufactured automotive hard parts, maintenance items, accessories and non-automotive products. In its domestic stores, Co. has a commercial sales program that provides commercial credit and prompt delivery of parts and other products to local, regional and national repair garages, dealers, service stations, fleet owners and other accounts. Co. also provides product information on its Duralast branded products.
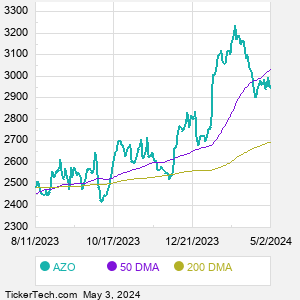
When researching a stock like AutoZone, many investors are the most familiar with Fundamental Analysis — looking at a company's balance sheet, earnings, revenues, and what's happening in that company's underlying business. Investors who use Fundamental Analysis to identify good stocks to buy or sell can also benefit from AZO Technical Analysis to help find a good entry or exit point. Technical Analysis is blind to the fundamentals and looks only at the trading data for AZO stock — the real life supply and demand for the stock over time — and examines that data in different ways. One of those ways is to calculate a Simpe Moving Average ("SMA") by looking back a certain number of days. One of the most popular "longer look-backs" is the AZO 200 day moving average ("AZO 200 DMA"), while one of the most popular "shorter look-backs" is the AZO 50 day moving average ("AZO 50 DMA"). A chart showing both of these popular moving averages is shown on this page for AutoZone. Comparing two moving averages against each other can be a useful visualization tool: by calculating the difference between the AZO 200 DMA and the AZO 50 DMA, we get a moving average convergence divergence indicator ("AZO MACD"). The AZO MACD chart, in conjunction with the chart of the moving averages, basically helps in visualizing how the moving averages are showing convergence (moving closer together), or divergence (moving farther apart). |