Truist Financial is a financial holding company. Through its subsidiary, Branch Banking and Trust Company, Co. provides banking services to individuals, businesses and municipalities. Co. provides loans and lease financing, including commercial and residential mortgages; permanent commercial real estate financing arrangements; loan servicing for third-party investors; direct consumer finance loans to individuals; credit card lending; automobile financing; and equipment financing. Co. also provides other services, including deposits; discount and brokerage, annuities and mutual funds; life insurance, property and casualty insurance, health insurance and commercial general liability insurance.
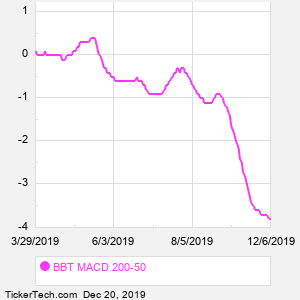
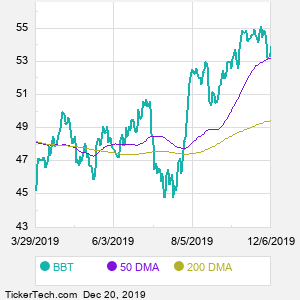
When researching a stock like BB and T, many investors are the most familiar with Fundamental Analysis — looking at a company's balance sheet, earnings, revenues, and what's happening in that company's underlying business. Investors who use Fundamental Analysis to identify good stocks to buy or sell can also benefit from BBT Technical Analysis to help find a good entry or exit point. Technical Analysis is blind to the fundamentals and looks only at the trading data for BBT stock — the real life supply and demand for the stock over time — and examines that data in different ways. One of those ways is to calculate a Simpe Moving Average ("SMA") by looking back a certain number of days. One of the most popular "longer look-backs" is the BBT 200 day moving average ("BBT 200 DMA"), while one of the most popular "shorter look-backs" is the BBT 50 day moving average ("BBT 50 DMA"). A chart showing both of these popular moving averages is shown on this page for BB and T. Comparing two moving averages against each other can be a useful visualization tool: by calculating the difference between the BBT 200 DMA and the BBT 50 DMA, we get a moving average convergence divergence indicator ("BBT MACD"). The BBT MACD chart, in conjunction with the chart of the moving averages, basically helps in visualizing how the moving averages are showing convergence (moving closer together), or divergence (moving farther apart). |