Brown & Brown is an insurance agency, wholesale brokerage, insurance programs and service organization. Co.'s segments are: Retail, which provides a range of insurance products and services and non-insurance services and products through its automobile dealer services businesses; National Programs, which provides program management capabilities for insurance carrier partners across various lines of business, that include personal lines programs, commercial lines programs, public entity programs and specialty programs; Wholesale Brokerage, which markets and sells excess and surplus commercial insurance products and services; and Services, which provides a range of insurance-related services.
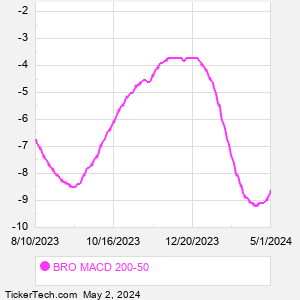
When researching a stock like Brown and Brown, many investors are the most familiar with Fundamental Analysis — looking at a company's balance sheet, earnings, revenues, and what's happening in that company's underlying business. Investors who use Fundamental Analysis to identify good stocks to buy or sell can also benefit from BRO Technical Analysis to help find a good entry or exit point. Technical Analysis is blind to the fundamentals and looks only at the trading data for BRO stock — the real life supply and demand for the stock over time — and examines that data in different ways. One of those ways is to calculate a Simpe Moving Average ("SMA") by looking back a certain number of days. One of the most popular "longer look-backs" is the BRO 200 day moving average ("BRO 200 DMA"), while one of the most popular "shorter look-backs" is the BRO 50 day moving average ("BRO 50 DMA"). A chart showing both of these popular moving averages is shown on this page for Brown and Brown. Comparing two moving averages against each other can be a useful visualization tool: by calculating the difference between the BRO 200 DMA and the BRO 50 DMA, we get a moving average convergence divergence indicator ("BRO MACD"). The BRO MACD chart, in conjunction with the chart of the moving averages, basically helps in visualizing how the moving averages are showing convergence (moving closer together), or divergence (moving farther apart). |