Carrier Global provides healthy, safe, sustainable and intelligent building and cold chain solutions with a focus on providing differentiated, digitally-enabled lifecycle solutions to its customers. Co.'s portfolio includes brands such as Carrier, Toshiba, Automated Logic, Carrier Transicold, Kidde, Edwards and LenelS2 that provide heating, ventilating and air conditioning (HVAC), refrigeration, fire, security and building automation technologies. Co. also provides a range of related building services, including audit, design, installation, system integration, repair, maintenance and monitoring. Co.'s operations are classified into three segments: HVAC, Refrigeration and Fire & Security.
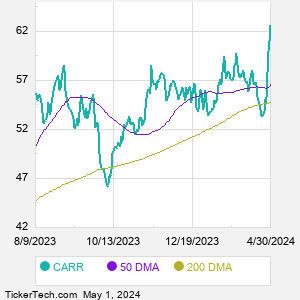
When researching a stock like Carrier Global, many investors are the most familiar with Fundamental Analysis — looking at a company's balance sheet, earnings, revenues, and what's happening in that company's underlying business. Investors who use Fundamental Analysis to identify good stocks to buy or sell can also benefit from CARR Technical Analysis to help find a good entry or exit point. Technical Analysis is blind to the fundamentals and looks only at the trading data for CARR stock — the real life supply and demand for the stock over time — and examines that data in different ways. One of those ways is to calculate a Simpe Moving Average ("SMA") by looking back a certain number of days. One of the most popular "longer look-backs" is the CARR 200 day moving average ("CARR 200 DMA"), while one of the most popular "shorter look-backs" is the CARR 50 day moving average ("CARR 50 DMA"). A chart showing both of these popular moving averages is shown on this page for Carrier Global. Comparing two moving averages against each other can be a useful visualization tool: by calculating the difference between the CARR 200 DMA and the CARR 50 DMA, we get a moving average convergence divergence indicator ("CARR MACD"). The CARR MACD chart, in conjunction with the chart of the moving averages, basically helps in visualizing how the moving averages are showing convergence (moving closer together), or divergence (moving farther apart). |