Cadence Design Systems provides solutions that enable customers to design products. Co.'s product offerings include software, hardware, services and reusable integrated circuit (IC) design blocks, which are referred to as intellectual property (IP). Co. also provides maintenance for its software, hardware, and IP product offerings. Co. groups its products into categories, including Custom IC Design and Simulation, which is used to create schematic and physical representations of circuits down to the transistor level for analog, mixed-signal, custom digital, memory and radio frequency designs; Digital IC Design and Signoff; Functional Verification; IP; and System Interconnect and Analysis.
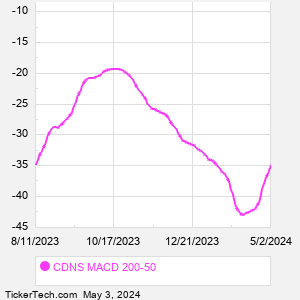
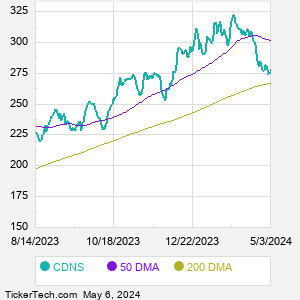
When researching a stock like Cadence Design Systems, many investors are the most familiar with Fundamental Analysis — looking at a company's balance sheet, earnings, revenues, and what's happening in that company's underlying business. Investors who use Fundamental Analysis to identify good stocks to buy or sell can also benefit from CDNS Technical Analysis to help find a good entry or exit point. Technical Analysis is blind to the fundamentals and looks only at the trading data for CDNS stock — the real life supply and demand for the stock over time — and examines that data in different ways. One of those ways is to calculate a Simpe Moving Average ("SMA") by looking back a certain number of days. One of the most popular "longer look-backs" is the CDNS 200 day moving average ("CDNS 200 DMA"), while one of the most popular "shorter look-backs" is the CDNS 50 day moving average ("CDNS 50 DMA"). A chart showing both of these popular moving averages is shown on this page for Cadence Design Systems. Comparing two moving averages against each other can be a useful visualization tool: by calculating the difference between the CDNS 200 DMA and the CDNS 50 DMA, we get a moving average convergence divergence indicator ("CDNS MACD"). The CDNS MACD chart, in conjunction with the chart of the moving averages, basically helps in visualizing how the moving averages are showing convergence (moving closer together), or divergence (moving farther apart). |