CDW is a holding company. Through its subsidiaries, Co. provides information technology solutions. Co.'s hardware products include notebooks/mobile devices (including tablets), network communications, desktop computers, video monitors, enterprise and data storage, and other hardware. Co.'s software products include application suites, security, virtualization, operating systems and network management. Co.'s services include advisory and design, software development, implementation, managed services and warranties. Co. provides public cloud solutions, which reside off customer premises on a public (shared) infrastructure, and private cloud solutions, which reside on customer premises.
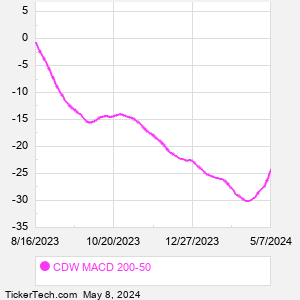
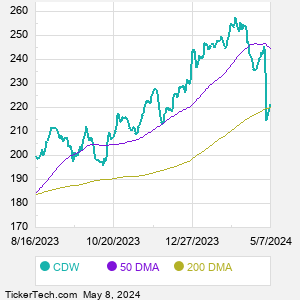
When researching a stock like CDW, many investors are the most familiar with Fundamental Analysis — looking at a company's balance sheet, earnings, revenues, and what's happening in that company's underlying business. Investors who use Fundamental Analysis to identify good stocks to buy or sell can also benefit from CDW Technical Analysis to help find a good entry or exit point. Technical Analysis is blind to the fundamentals and looks only at the trading data for CDW stock — the real life supply and demand for the stock over time — and examines that data in different ways. One of those ways is to calculate a Simpe Moving Average ("SMA") by looking back a certain number of days. One of the most popular "longer look-backs" is the CDW 200 day moving average ("CDW 200 DMA"), while one of the most popular "shorter look-backs" is the CDW 50 day moving average ("CDW 50 DMA"). A chart showing both of these popular moving averages is shown on this page for CDW. Comparing two moving averages against each other can be a useful visualization tool: by calculating the difference between the CDW 200 DMA and the CDW 50 DMA, we get a moving average convergence divergence indicator ("CDW MACD"). The CDW MACD chart, in conjunction with the chart of the moving averages, basically helps in visualizing how the moving averages are showing convergence (moving closer together), or divergence (moving farther apart). |