Cerner designs, develops, markets, installs, hosts and supports health care information technology, health care devices, hardware and content solutions for health care organizations and consumers. Co. also provides a range of services, including implementation and training, remote hosting, operational management services, revenue cycle services, support and maintenance, transaction processing, employer health centers, employee wellness programs and third party administrator services for employer-based health plans. Co. has two operating segments: Domestic, which includes business activity in the U.S.; and International, which includes business activity outside the U.S.
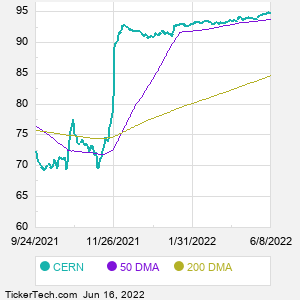
When researching a stock like Cerner, many investors are the most familiar with Fundamental Analysis — looking at a company's balance sheet, earnings, revenues, and what's happening in that company's underlying business. Investors who use Fundamental Analysis to identify good stocks to buy or sell can also benefit from CERN Technical Analysis to help find a good entry or exit point. Technical Analysis is blind to the fundamentals and looks only at the trading data for CERN stock — the real life supply and demand for the stock over time — and examines that data in different ways. One of those ways is to calculate a Simpe Moving Average ("SMA") by looking back a certain number of days. One of the most popular "longer look-backs" is the CERN 200 day moving average ("CERN 200 DMA"), while one of the most popular "shorter look-backs" is the CERN 50 day moving average ("CERN 50 DMA"). A chart showing both of these popular moving averages is shown on this page for Cerner. Comparing two moving averages against each other can be a useful visualization tool: by calculating the difference between the CERN 200 DMA and the CERN 50 DMA, we get a moving average convergence divergence indicator ("CERN MACD"). The CERN MACD chart, in conjunction with the chart of the moving averages, basically helps in visualizing how the moving averages are showing convergence (moving closer together), or divergence (moving farther apart). |