CI MACD


As of date:3/15/2024
CI stock price:352.05
CI 50 DMA:324.10
CI 200 DMA:293.20
CI MACD (200-50):-30.90

Also see:
CI Market Cap History
CI Shares Outstanding History
CI YTD Return
CI DMA
CI RSI
CI Technical Analysis

FWONK Crosses Below Key Moving Average Level
1 hour, 19 minutes ago


Lands' End Breaks Below 200-Day Moving Average - Notable for LE
1 hour, 25 minutes ago


Notable Two Hundred Day Moving Average Cross - CATY
1 hour, 28 minutes ago


MEOH Makes Bullish Cross Above Critical Moving Average
1 hour, 28 minutes ago


HELE Makes Notable Cross Below Critical Moving Average
1 hour, 29 minutes ago


iShares 3-7 Year Treasury Bond (IEI) Shares Cross Below 200 DMA
1 hour, 42 minutes ago


First Trust TCW Opportunistic Fixed Income Breaks Below 200-Day Moving Average - Notable for FIXD
1 hour, 42 minutes ago


BSMO Makes Notable Cross Below Critical Moving Average
1 hour, 48 minutes ago


TMV Makes Bullish Cross Above Critical Moving Average
1 hour, 49 minutes ago


Invesco DB Oil Fund Breaks Above 200-Day Moving Average - Bullish for DBO
1 hour, 49 minutes ago


iShares J.P. Morgan EM Local Currency Bond Breaks Below 200-Day Moving Average - Notable for LEMB
1 hour, 49 minutes ago


BLV Crosses Below Key Moving Average Level
1 hour, 49 minutes ago


LI Makes Notable Cross Below Critical Moving Average
6 hours, 10 minutes ago


Bullish Two Hundred Day Moving Average Cross - NVEI
6 hours, 10 minutes ago


Terns Pharmaceuticals (TERN) Shares Cross Below 200 DMA
6 hours, 12 minutes ago


More Technical Analysis News

CI MACDCI DMA
The Cigna Group, together with its subsidiaries, is a global health service organization. Co.'s segments include: Evernorth, which includes a range of coordinated and point solution health services, as well as those from partners across the health care system, in pharmacy solutions, benefits management solutions, care delivery and care management solutions and other solutions; Cigna Healthcare, which includes Co.'s U.S. Commercial, U.S. Government and International Health operating segments that provide medical and coordinated solutions to clients and customers; and Other Operations, which includes ongoing business, exiting business, and run-off businesses.

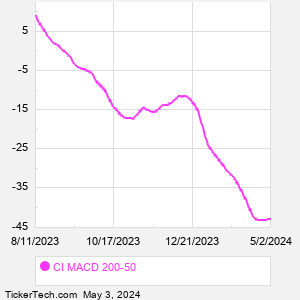
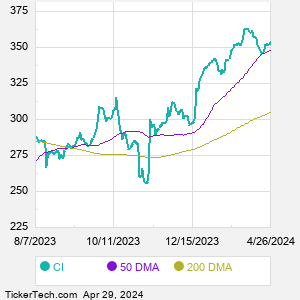
When researching a stock like Cigna, many investors are the most familiar with Fundamental Analysis — looking at a company's balance sheet, earnings, revenues, and what's happening in that company's underlying business. Investors who use Fundamental Analysis to identify good stocks to buy or sell can also benefit from CI Technical Analysis to help find a good entry or exit point. Technical Analysis is blind to the fundamentals and looks only at the trading data for CI stock — the real life supply and demand for the stock over time — and examines that data in different ways. One of those ways is to calculate a Simpe Moving Average ("SMA") by looking back a certain number of days. One of the most popular "longer look-backs" is the CI 200 day moving average ("CI 200 DMA"), while one of the most popular "shorter look-backs" is the CI 50 day moving average ("CI 50 DMA"). A chart showing both of these popular moving averages is shown on this page for Cigna. Comparing two moving averages against each other can be a useful visualization tool: by calculating the difference between the CI 200 DMA and the CI 50 DMA, we get a moving average convergence divergence indicator ("CI MACD"). The CI MACD chart, in conjunction with the chart of the moving averages, basically helps in visualizing how the moving averages are showing convergence (moving closer together), or divergence (moving farther apart).
10 Most Oversold S&P 500 Stocks
10 Most Overbought S&P 500 Stocks

10 ETFs With Stocks Insiders Are Buying
10 ETFs With Most Upside To Targets
The DividendRank Top 25
Warren Buffett Dividend Stocks
10 Cheap Dividend Stocks Under $10
10 Top DividendRank'ed Energy Stocks
The 10 Highest Yielding Preferred Stocks
The 15 Most Active S&P Call & Put Options
Quotes delayed 20 minutes

Email EnvelopeFree CI Email Alerts:
Get Dividend Alerts
Get SEC Filing Alerts
Video: Technical Analysis


If the video does not load after a few moments, Upgrade to the Latest Flash Player.
Cigna (CI) is categorized under the Healthcare sector; to help you further research MACD, below are some other companies in the same sector:

CNC MACD
COO MACD
COR MACD
CRL MACD
CTLT MACD
CVS MACD
DGX MACD
DHR MACD
DVA MACD
DXCM MACD
More Healthcare companies »


CI MACD | www.StockMACD.com | Copyright © 2019 - 2024, All Rights Reserved

Nothing in StockMACD.com is intended to be investment advice, nor does it represent the opinion of, counsel from, or recommendations by BNK Invest Inc. or any of its affiliates, subsidiaries or partners. None of the information contained herein constitutes a recommendation that any particular security, portfolio, transaction, or investment strategy is suitable for any specific person. All viewers agree that under no circumstances will BNK Invest, Inc,. its subsidiaries, partners, officers, employees, affiliates, or agents be held liable for any loss or damage caused by your reliance on information obtained. By visiting, using or viewing this site, you agree to the following Full Disclaimer & Terms of Use and Privacy Policy. Video widget and market videos powered by Market News Video. Quote and option data delayed at least 15 minutes; stock quote data powered by Ticker Technologies, and Mergent.
X
Wait! Don't leave yet.
Want to receive our latest research absolutely free?


Click the button below for your complimentary copy of Your Early Retirement Portfolio: Dividends Up to 9.5%—Every Month—Forever.

You'll discover the details on 4 stocks and funds that pay you massive dividends as high as 9.5%.