Campbell Soup is a manufacturer and marketer of food and beverage products. Co.'s reportable segments are: meals and beverages, which consist of Co.'s soup, meals and beverages products in retail and foodservice in the U.S. and Canada; and snacks, which consist of Pepperidge Farm cookies, crackers, fresh bakery and frozen products, including Goldfish crackers, Snyder's of Hanover pretzels, Lance sandwich crackers, Cape Cod potato chips, Kettle Brand potato chips, Late July snacks, Snack Factory pretzel crisps, Pop Secret popcorn, and other snacking products in retail in the U.S., as well as the retail business in Latin America.
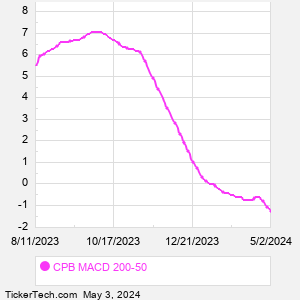
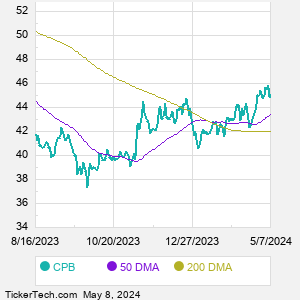
When researching a stock like Campbell Soup, many investors are the most familiar with Fundamental Analysis — looking at a company's balance sheet, earnings, revenues, and what's happening in that company's underlying business. Investors who use Fundamental Analysis to identify good stocks to buy or sell can also benefit from CPB Technical Analysis to help find a good entry or exit point. Technical Analysis is blind to the fundamentals and looks only at the trading data for CPB stock — the real life supply and demand for the stock over time — and examines that data in different ways. One of those ways is to calculate a Simpe Moving Average ("SMA") by looking back a certain number of days. One of the most popular "longer look-backs" is the CPB 200 day moving average ("CPB 200 DMA"), while one of the most popular "shorter look-backs" is the CPB 50 day moving average ("CPB 50 DMA"). A chart showing both of these popular moving averages is shown on this page for Campbell Soup. Comparing two moving averages against each other can be a useful visualization tool: by calculating the difference between the CPB 200 DMA and the CPB 50 DMA, we get a moving average convergence divergence indicator ("CPB MACD"). The CPB MACD chart, in conjunction with the chart of the moving averages, basically helps in visualizing how the moving averages are showing convergence (moving closer together), or divergence (moving farther apart). |