Capri Holdings is a holding company. Through its subsidiaries, Co. is a designer, marketer, distributor and retailer of women's and men's accessories, apparel and footwear bearing the Versace, Jimmy Choo and Michael Kors tradenames and related trademarks and logos. Co.'s brands cover a range of fashion categories including women's and men's accessories, footwear and ready-to-wear, as well as wearable technology, watches, jewelry, eyewear and a line of fragrance products. Co. sells its Versace, Jimmy Choo and Michael Kors products through retail and wholesale channels in the Americas (U.S., Canada and Latin America), Europe, Middle East and Africa, and Asia (Asia and Oceania) markets.
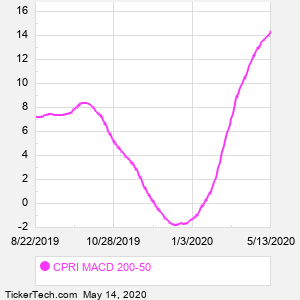
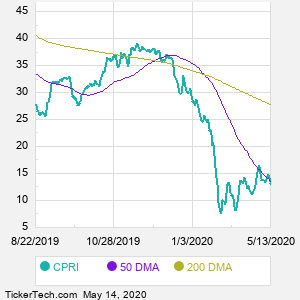
When researching a stock like Capri Holdings, many investors are the most familiar with Fundamental Analysis — looking at a company's balance sheet, earnings, revenues, and what's happening in that company's underlying business. Investors who use Fundamental Analysis to identify good stocks to buy or sell can also benefit from CPRI Technical Analysis to help find a good entry or exit point. Technical Analysis is blind to the fundamentals and looks only at the trading data for CPRI stock — the real life supply and demand for the stock over time — and examines that data in different ways. One of those ways is to calculate a Simpe Moving Average ("SMA") by looking back a certain number of days. One of the most popular "longer look-backs" is the CPRI 200 day moving average ("CPRI 200 DMA"), while one of the most popular "shorter look-backs" is the CPRI 50 day moving average ("CPRI 50 DMA"). A chart showing both of these popular moving averages is shown on this page for Capri Holdings. Comparing two moving averages against each other can be a useful visualization tool: by calculating the difference between the CPRI 200 DMA and the CPRI 50 DMA, we get a moving average convergence divergence indicator ("CPRI MACD"). The CPRI MACD chart, in conjunction with the chart of the moving averages, basically helps in visualizing how the moving averages are showing convergence (moving closer together), or divergence (moving farther apart). |