CSX is a transportation company. Co. provides rail-based freight transportation services including rail service, the transport of intermodal containers and trailers, as well as other transportation services such as rail-to-truck transfers and bulk commodity operations. Co.'s principal operating subsidiary, CSX Transportation, Inc. (CSXT), provides a link to the transportation supply chain through its rail network, which serves main population centers in various states east of the Mississippi River, the District of Columbia and the Canadian provinces of Ontario and Quebec. CXST is also responsible for Co.'s real estate sales, leasing, acquisition and management and development activities.
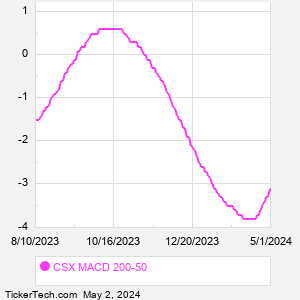
When researching a stock like CSX, many investors are the most familiar with Fundamental Analysis — looking at a company's balance sheet, earnings, revenues, and what's happening in that company's underlying business. Investors who use Fundamental Analysis to identify good stocks to buy or sell can also benefit from CSX Technical Analysis to help find a good entry or exit point. Technical Analysis is blind to the fundamentals and looks only at the trading data for CSX stock — the real life supply and demand for the stock over time — and examines that data in different ways. One of those ways is to calculate a Simpe Moving Average ("SMA") by looking back a certain number of days. One of the most popular "longer look-backs" is the CSX 200 day moving average ("CSX 200 DMA"), while one of the most popular "shorter look-backs" is the CSX 50 day moving average ("CSX 50 DMA"). A chart showing both of these popular moving averages is shown on this page for CSX. Comparing two moving averages against each other can be a useful visualization tool: by calculating the difference between the CSX 200 DMA and the CSX 50 DMA, we get a moving average convergence divergence indicator ("CSX MACD"). The CSX MACD chart, in conjunction with the chart of the moving averages, basically helps in visualizing how the moving averages are showing convergence (moving closer together), or divergence (moving farther apart). |