CVS Health is a health solutions company. Co.'s segments include:Health Care Benefits, which provides voluntary and consumer-directed health insurance products and related services, including medical, pharmacy, and dental and behavioral health plans; Pharmacy Services, which provides pharmacy benefit management solutions, including plan design offerings and administration, formulary management, and retail pharmacy network management services; and Retail/Long-Term Care (LTC), which sells prescription drugs and various health and wellness products and general merchandise, provides health care services through its MinuteClinic® walk-in medical clinics and conducts LTC pharmacy operations.
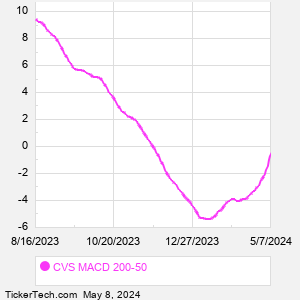
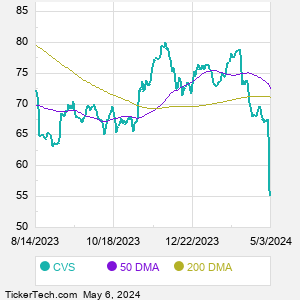
When researching a stock like CVS Health, many investors are the most familiar with Fundamental Analysis — looking at a company's balance sheet, earnings, revenues, and what's happening in that company's underlying business. Investors who use Fundamental Analysis to identify good stocks to buy or sell can also benefit from CVS Technical Analysis to help find a good entry or exit point. Technical Analysis is blind to the fundamentals and looks only at the trading data for CVS stock — the real life supply and demand for the stock over time — and examines that data in different ways. One of those ways is to calculate a Simpe Moving Average ("SMA") by looking back a certain number of days. One of the most popular "longer look-backs" is the CVS 200 day moving average ("CVS 200 DMA"), while one of the most popular "shorter look-backs" is the CVS 50 day moving average ("CVS 50 DMA"). A chart showing both of these popular moving averages is shown on this page for CVS Health. Comparing two moving averages against each other can be a useful visualization tool: by calculating the difference between the CVS 200 DMA and the CVS 50 DMA, we get a moving average convergence divergence indicator ("CVS MACD"). The CVS MACD chart, in conjunction with the chart of the moving averages, basically helps in visualizing how the moving averages are showing convergence (moving closer together), or divergence (moving farther apart). |