Discover Financial Services is a bank holding company as well as a financial holding company. Co. provides digital banking products and services and payment services through its subsidiaries. Co. manages its business activities in two segments: Digital Banking, which includes consumer banking and lending products, mainly Discover-branded credit cards issued to individuals on the Discover Network and other consumer banking products and services, including private student loans; and Payment Services, which includes the PULSE network, Diners Club International and its Network Partners business that provides payment transaction processing and settlement services on the Discover Global Network.
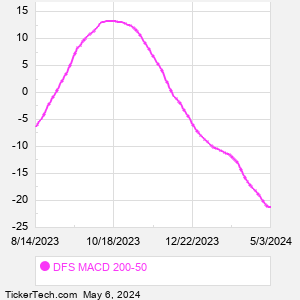
When researching a stock like Discover Financial Services, many investors are the most familiar with Fundamental Analysis — looking at a company's balance sheet, earnings, revenues, and what's happening in that company's underlying business. Investors who use Fundamental Analysis to identify good stocks to buy or sell can also benefit from DFS Technical Analysis to help find a good entry or exit point. Technical Analysis is blind to the fundamentals and looks only at the trading data for DFS stock — the real life supply and demand for the stock over time — and examines that data in different ways. One of those ways is to calculate a Simpe Moving Average ("SMA") by looking back a certain number of days. One of the most popular "longer look-backs" is the DFS 200 day moving average ("DFS 200 DMA"), while one of the most popular "shorter look-backs" is the DFS 50 day moving average ("DFS 50 DMA"). A chart showing both of these popular moving averages is shown on this page for Discover Financial Services. Comparing two moving averages against each other can be a useful visualization tool: by calculating the difference between the DFS 200 DMA and the DFS 50 DMA, we get a moving average convergence divergence indicator ("DFS MACD"). The DFS MACD chart, in conjunction with the chart of the moving averages, basically helps in visualizing how the moving averages are showing convergence (moving closer together), or divergence (moving farther apart). |