Quest Diagnostics provides diagnostic information services. Co. is made up of two businesses: Diagnostic Information Services, which develops and delivers diagnostic information services, providing insights that allow and enable a range of customers, including patients, clinicians, hospitals, independent delivery networks (including hospital health systems), health plans, employers, accountable care organizations and direct contract entities; and Diagnostic Solutions, which includes Co.'s risk assessment services business, which provides solutions for insurers, and Co.'s healthcare information technology businesses, which provides solutions for healthcare providers.
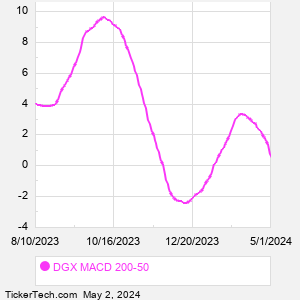
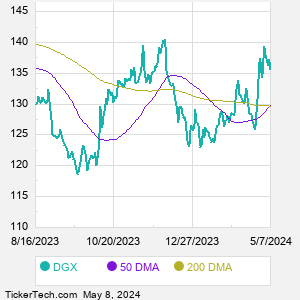
When researching a stock like Quest Diagnostics, many investors are the most familiar with Fundamental Analysis — looking at a company's balance sheet, earnings, revenues, and what's happening in that company's underlying business. Investors who use Fundamental Analysis to identify good stocks to buy or sell can also benefit from DGX Technical Analysis to help find a good entry or exit point. Technical Analysis is blind to the fundamentals and looks only at the trading data for DGX stock — the real life supply and demand for the stock over time — and examines that data in different ways. One of those ways is to calculate a Simpe Moving Average ("SMA") by looking back a certain number of days. One of the most popular "longer look-backs" is the DGX 200 day moving average ("DGX 200 DMA"), while one of the most popular "shorter look-backs" is the DGX 50 day moving average ("DGX 50 DMA"). A chart showing both of these popular moving averages is shown on this page for Quest Diagnostics. Comparing two moving averages against each other can be a useful visualization tool: by calculating the difference between the DGX 200 DMA and the DGX 50 DMA, we get a moving average convergence divergence indicator ("DGX MACD"). The DGX MACD chart, in conjunction with the chart of the moving averages, basically helps in visualizing how the moving averages are showing convergence (moving closer together), or divergence (moving farther apart). |