Horton (DR) is a homebuilding company. Co. constructs and sells homes through its operating divisions, mainly under the names of D.R. Horton, America's Builder, Emerald Homes, Express Homes and Freedom Homes. Co.'s business operations consist of homebuilding, a majority-owned residential lot development company, financial services, rental and other activities. Co. sells single-family detached homes, as well as attached homes, such as townhomes, duplexes and triplexes. Co.'s financial services operations provide mortgage financing and title agency services to homebuyers in majority of its homebuilding markets. Co.'s rental segment consists of multi-family and single-family rental operations.
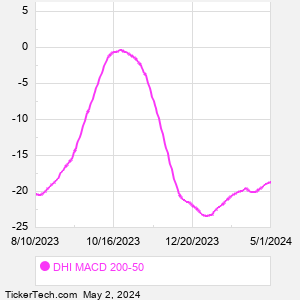
When researching a stock like Horton, many investors are the most familiar with Fundamental Analysis — looking at a company's balance sheet, earnings, revenues, and what's happening in that company's underlying business. Investors who use Fundamental Analysis to identify good stocks to buy or sell can also benefit from DHI Technical Analysis to help find a good entry or exit point. Technical Analysis is blind to the fundamentals and looks only at the trading data for DHI stock — the real life supply and demand for the stock over time — and examines that data in different ways. One of those ways is to calculate a Simpe Moving Average ("SMA") by looking back a certain number of days. One of the most popular "longer look-backs" is the DHI 200 day moving average ("DHI 200 DMA"), while one of the most popular "shorter look-backs" is the DHI 50 day moving average ("DHI 50 DMA"). A chart showing both of these popular moving averages is shown on this page for Horton. Comparing two moving averages against each other can be a useful visualization tool: by calculating the difference between the DHI 200 DMA and the DHI 50 DMA, we get a moving average convergence divergence indicator ("DHI MACD"). The DHI MACD chart, in conjunction with the chart of the moving averages, basically helps in visualizing how the moving averages are showing convergence (moving closer together), or divergence (moving farther apart). |