DISH Network is a holding company. Through its subsidiaries, Co. operates two primary business segments: Pay-TV and Wireless. Co. provides pay-TV services under the DISH® brand and the SLING® brand. Co. also designs, develops and distributes receiver systems and provides digital broadcast operations. Co. provides prepaid and postpaid retail wireless services to subscribers under its Boost Mobile, Ting Mobile, Republic Wireless and Gen Mobile brands, as well as a portfolio of wireless devices. Co. also invests to acquire wireless spectrum licenses. These wireless spectrum licenses are subject to certain interim and final build-out requirements, as well as certain renewal requirements.
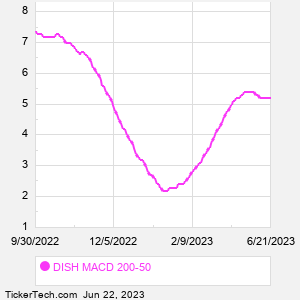
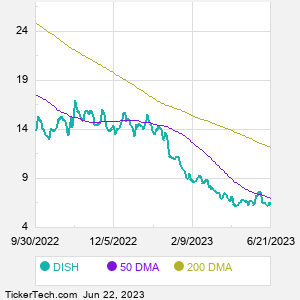
When researching a stock like DISH Network, many investors are the most familiar with Fundamental Analysis — looking at a company's balance sheet, earnings, revenues, and what's happening in that company's underlying business. Investors who use Fundamental Analysis to identify good stocks to buy or sell can also benefit from DISH Technical Analysis to help find a good entry or exit point. Technical Analysis is blind to the fundamentals and looks only at the trading data for DISH stock — the real life supply and demand for the stock over time — and examines that data in different ways. One of those ways is to calculate a Simpe Moving Average ("SMA") by looking back a certain number of days. One of the most popular "longer look-backs" is the DISH 200 day moving average ("DISH 200 DMA"), while one of the most popular "shorter look-backs" is the DISH 50 day moving average ("DISH 50 DMA"). A chart showing both of these popular moving averages is shown on this page for DISH Network. Comparing two moving averages against each other can be a useful visualization tool: by calculating the difference between the DISH 200 DMA and the DISH 50 DMA, we get a moving average convergence divergence indicator ("DISH MACD"). The DISH MACD chart, in conjunction with the chart of the moving averages, basically helps in visualizing how the moving averages are showing convergence (moving closer together), or divergence (moving farther apart). |