Enphase Energy is a global energy technology company. Co. designs, develops, manufactures and sells home energy solutions that manage energy generation, energy storage and control and communications on one platform. Co.'s semiconductor-based microinverter converts energy at the individual solar module level and combines with its proprietary networking and software technologies to provide energy monitoring and control. The Enphase Energy System, powered by IQ™ Microinverters and IQ™ Batteries, Co.'s power generation integrated solar, storage, and energy management offering, enables self-consumption, simplifying design and installation, and improving system uptime and reliability.
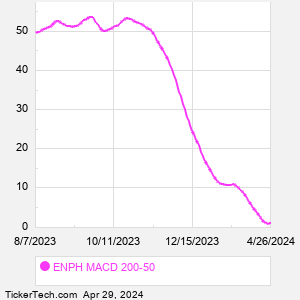
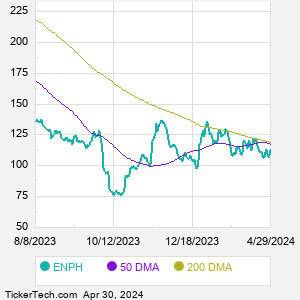
When researching a stock like Enphase Energy, many investors are the most familiar with Fundamental Analysis — looking at a company's balance sheet, earnings, revenues, and what's happening in that company's underlying business. Investors who use Fundamental Analysis to identify good stocks to buy or sell can also benefit from ENPH Technical Analysis to help find a good entry or exit point. Technical Analysis is blind to the fundamentals and looks only at the trading data for ENPH stock — the real life supply and demand for the stock over time — and examines that data in different ways. One of those ways is to calculate a Simpe Moving Average ("SMA") by looking back a certain number of days. One of the most popular "longer look-backs" is the ENPH 200 day moving average ("ENPH 200 DMA"), while one of the most popular "shorter look-backs" is the ENPH 50 day moving average ("ENPH 50 DMA"). A chart showing both of these popular moving averages is shown on this page for Enphase Energy. Comparing two moving averages against each other can be a useful visualization tool: by calculating the difference between the ENPH 200 DMA and the ENPH 50 DMA, we get a moving average convergence divergence indicator ("ENPH MACD"). The ENPH MACD chart, in conjunction with the chart of the moving averages, basically helps in visualizing how the moving averages are showing convergence (moving closer together), or divergence (moving farther apart). |