F5 is a provider of multi-cloud application security and delivery solutions which enable its customers to develop, deploy, operate, secure, and govern applications in any architecture, from on-premises to the public cloud. Co.'s application services are available as cloud-based, software-as-a-service, and software-only solutions supported for multi-cloud environments. In connection with its solutions, Co. provides a range of other services, including consulting, training, installation, maintenance, and other technical support services. Co.'s products and solutions include: BIG-IP Software and Systems; NGINX Software Solutions; Distributed Cloud Services; and Silverline Managed Services.
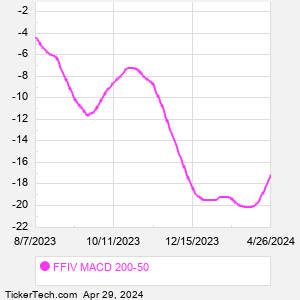
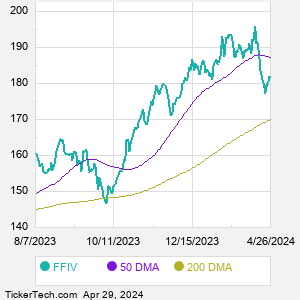
When researching a stock like F5 Networks, many investors are the most familiar with Fundamental Analysis — looking at a company's balance sheet, earnings, revenues, and what's happening in that company's underlying business. Investors who use Fundamental Analysis to identify good stocks to buy or sell can also benefit from FFIV Technical Analysis to help find a good entry or exit point. Technical Analysis is blind to the fundamentals and looks only at the trading data for FFIV stock — the real life supply and demand for the stock over time — and examines that data in different ways. One of those ways is to calculate a Simpe Moving Average ("SMA") by looking back a certain number of days. One of the most popular "longer look-backs" is the FFIV 200 day moving average ("FFIV 200 DMA"), while one of the most popular "shorter look-backs" is the FFIV 50 day moving average ("FFIV 50 DMA"). A chart showing both of these popular moving averages is shown on this page for F5 Networks. Comparing two moving averages against each other can be a useful visualization tool: by calculating the difference between the FFIV 200 DMA and the FFIV 50 DMA, we get a moving average convergence divergence indicator ("FFIV MACD"). The FFIV MACD chart, in conjunction with the chart of the moving averages, basically helps in visualizing how the moving averages are showing convergence (moving closer together), or divergence (moving farther apart). |