Fiserv is a global provider of payments and financial services technology solutions. Co. serves clients around the globe, including merchants, banks, credit unions, other financial institutions and corporate clients. Co.'s operations are comprised of: Merchant Acceptance, which enables businesses to accept consumers' electronic payment transactions online or in-person; Financial Technology, which provides financial institutions around the world with the technology solutions they need to run their operations; and Payments and Network, which provides financial institutions and corporate clients around the world with the products and services required to process digital payment transactions.
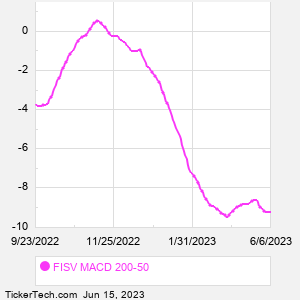
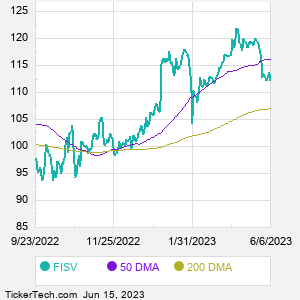
When researching a stock like Fiserv, many investors are the most familiar with Fundamental Analysis — looking at a company's balance sheet, earnings, revenues, and what's happening in that company's underlying business. Investors who use Fundamental Analysis to identify good stocks to buy or sell can also benefit from FISV Technical Analysis to help find a good entry or exit point. Technical Analysis is blind to the fundamentals and looks only at the trading data for FISV stock — the real life supply and demand for the stock over time — and examines that data in different ways. One of those ways is to calculate a Simpe Moving Average ("SMA") by looking back a certain number of days. One of the most popular "longer look-backs" is the FISV 200 day moving average ("FISV 200 DMA"), while one of the most popular "shorter look-backs" is the FISV 50 day moving average ("FISV 50 DMA"). A chart showing both of these popular moving averages is shown on this page for Fiserv. Comparing two moving averages against each other can be a useful visualization tool: by calculating the difference between the FISV 200 DMA and the FISV 50 DMA, we get a moving average convergence divergence indicator ("FISV MACD"). The FISV MACD chart, in conjunction with the chart of the moving averages, basically helps in visualizing how the moving averages are showing convergence (moving closer together), or divergence (moving farther apart). |