Fifth Third Bancorp is a bank holding company. Through its subsidiaries, Co. provides a range of financial products and services to the commercial, financial, retail, governmental, educational, energy and healthcare sectors. This includes a range of checking, savings and money market accounts, wealth management solutions, payments and commerce solutions, insurance services and credit products such as commercial loans and leases, mortgage loans, credit cards, installment loans and auto loans. These products and services are delivered through a variety of channels including Co.'s banking centers, other offices, telephone sales, the internet and mobile applications.
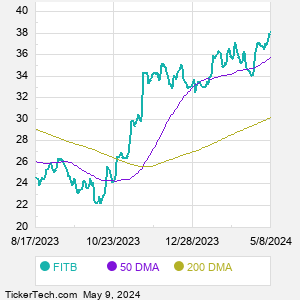
When researching a stock like Fifth Third Bancorp, many investors are the most familiar with Fundamental Analysis — looking at a company's balance sheet, earnings, revenues, and what's happening in that company's underlying business. Investors who use Fundamental Analysis to identify good stocks to buy or sell can also benefit from FITB Technical Analysis to help find a good entry or exit point. Technical Analysis is blind to the fundamentals and looks only at the trading data for FITB stock — the real life supply and demand for the stock over time — and examines that data in different ways. One of those ways is to calculate a Simpe Moving Average ("SMA") by looking back a certain number of days. One of the most popular "longer look-backs" is the FITB 200 day moving average ("FITB 200 DMA"), while one of the most popular "shorter look-backs" is the FITB 50 day moving average ("FITB 50 DMA"). A chart showing both of these popular moving averages is shown on this page for Fifth Third Bancorp. Comparing two moving averages against each other can be a useful visualization tool: by calculating the difference between the FITB 200 DMA and the FITB 50 DMA, we get a moving average convergence divergence indicator ("FITB MACD"). The FITB MACD chart, in conjunction with the chart of the moving averages, basically helps in visualizing how the moving averages are showing convergence (moving closer together), or divergence (moving farther apart). |