FMC MACD


FMC MACDFMC DMA
FMC is an agricultural sciences company focused on helping growers produce food, feed, fiber and fuel. Co.'s pesticide categories are: insecticides, herbicides and fungicides. Co.'s product lines consist of insecticides and herbicides and Co. has a portfolio of fungicides used in crop segments. Co.'s insecticides are used to control pests, while its herbicide portfolio primarily targets a variety of weeds. In addition, Co. is also investing substantially in its Plant Health program which includes biological crop protection products, seed treatments and micro-nutrients. Co.'s product portfolio features two molecules, Rynaxypyr® (chlorantraniliprole) and Cyazypyr® (cyantraniliprole) actives.

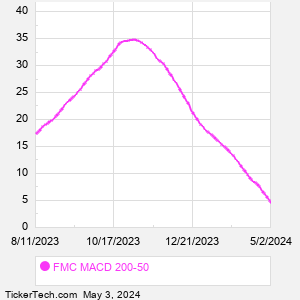
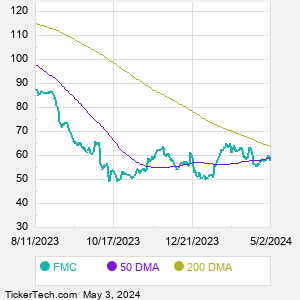
When researching a stock like FMC, many investors are the most familiar with Fundamental Analysis — looking at a company's balance sheet, earnings, revenues, and what's happening in that company's underlying business. Investors who use Fundamental Analysis to identify good stocks to buy or sell can also benefit from FMC Technical Analysis to help find a good entry or exit point. Technical Analysis is blind to the fundamentals and looks only at the trading data for FMC stock — the real life supply and demand for the stock over time — and examines that data in different ways. One of those ways is to calculate a Simpe Moving Average ("SMA") by looking back a certain number of days. One of the most popular "longer look-backs" is the FMC 200 day moving average ("FMC 200 DMA"), while one of the most popular "shorter look-backs" is the FMC 50 day moving average ("FMC 50 DMA"). A chart showing both of these popular moving averages is shown on this page for FMC. Comparing two moving averages against each other can be a useful visualization tool: by calculating the difference between the FMC 200 DMA and the FMC 50 DMA, we get a moving average convergence divergence indicator ("FMC MACD"). The FMC MACD chart, in conjunction with the chart of the moving averages, basically helps in visualizing how the moving averages are showing convergence (moving closer together), or divergence (moving farther apart).
10 Most Oversold S&P 500 Stocks
10 Most Overbought S&P 500 Stocks

10 ETFs With Stocks Insiders Are Buying
10 ETFs With Most Upside To Targets
The DividendRank Top 25
Warren Buffett Dividend Stocks
10 Cheap Dividend Stocks Under $10
10 Top DividendRank'ed Energy Stocks
The 10 Highest Yielding Preferred Stocks
The 15 Most Active S&P Call & Put Options
Quotes delayed 20 minutes

Email EnvelopeFree FMC Email Alerts:
Get Dividend Alerts
Get SEC Filing Alerts
Video: Technical Analysis


If the video does not load after a few moments, Upgrade to the Latest Flash Player.
FMC (FMC) is categorized under the Materials sector; to help you further research MACD, below are some other companies in the same sector:

HWM MACD
IFF MACD
IP MACD
LIN MACD
LYB MACD
MAS MACD
MHK MACD
MLM MACD
MOS MACD
NEM MACD
More Materials companies »


FMC MACD | www.StockMACD.com | Copyright © 2019 - 2024, All Rights Reserved

Nothing in StockMACD.com is intended to be investment advice, nor does it represent the opinion of, counsel from, or recommendations by BNK Invest Inc. or any of its affiliates, subsidiaries or partners. None of the information contained herein constitutes a recommendation that any particular security, portfolio, transaction, or investment strategy is suitable for any specific person. All viewers agree that under no circumstances will BNK Invest, Inc,. its subsidiaries, partners, officers, employees, affiliates, or agents be held liable for any loss or damage caused by your reliance on information obtained. By visiting, using or viewing this site, you agree to the following Full Disclaimer & Terms of Use and Privacy Policy. Video widget and market videos powered by Market News Video. Quote and option data delayed at least 15 minutes; stock quote data powered by Ticker Technologies, and Mergent.
X
Wait! Don't leave yet.
Want to receive our latest research absolutely free?


Click the button below for your complimentary copy of Your Early Retirement Portfolio: Dividends Up to 8.7%—Every Month—Forever.

You'll discover the details on 4 stocks and funds that pay you massive dividends as high as 8.7%.