| FRT MACD Data | ||||||||||
Also see: |


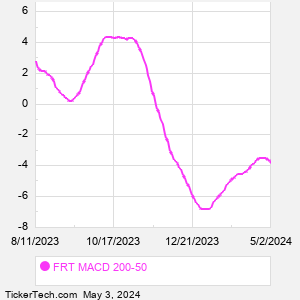
| FRT MACD Chart |
  |
| About Federal Realty Investment Trust (New) |
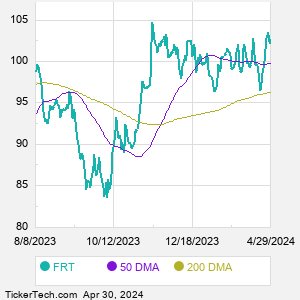
| Federal Realty Investment Trust is a holding company. Through its subsidiaries, Co. is an equity real estate investment trust focusing on the ownership, management, and redevelopment of retail and mixed-use properties located primarily in communities in selected metropolitan markets in the Northeast and Mid-Atlantic regions of the U.S., California, and South Florida. Co. owns or has a majority interest in community and neighborhood shopping centers and mixed-use properties which are operated as predominantly retail real estate projects. When researching a stock like Federal Realty Investment Trust, many investors are the most familiar with Fundamental Analysis — looking at a company's balance sheet, earnings, revenues, and what's happening in that company's underlying business. Investors who use Fundamental Analysis to identify good stocks to buy or sell can also benefit from FRT Technical Analysis to help find a good entry or exit point. Technical Analysis is blind to the fundamentals and looks only at the trading data for FRT stock — the real life supply and demand for the stock over time — and examines that data in different ways. One of those ways is to calculate a Simpe Moving Average ("SMA") by looking back a certain number of days. One of the most popular "longer look-backs" is the FRT 200 day moving average ("FRT 200 DMA"), while one of the most popular "shorter look-backs" is the FRT 50 day moving average ("FRT 50 DMA"). A chart showing both of these popular moving averages is shown on this page for Federal Realty Investment Trust. Comparing two moving averages against each other can be a useful visualization tool: by calculating the difference between the FRT 200 DMA and the FRT 50 DMA, we get a moving average convergence divergence indicator ("FRT MACD"). The FRT MACD chart, in conjunction with the chart of the moving averages, basically helps in visualizing how the moving averages are showing convergence (moving closer together), or divergence (moving farther apart). |
| FRT Current Stock Quote |
Get Dividend Alerts Get SEC Filing Alerts |
| FRT Stock Price Chart |
| Video: Technical Analysis | |
|
| FRT MACD Peers |
| Federal Realty Investment Trust (FRT) is categorized under the Financials sector; to help you further research MACD, below are some other companies in the same sector:
GL MACD |