Garmin, through its subsidiaries, designs, develops, manufactures, markets and distributes a family of hand-held, wearable, portable and fixed-mount Global Positioning System-enabled products and other navigation, communications, sensor-based and information products. Co. 's primary markets include: Fitness, which provides range of products for use in fitness and activity tracking; Outdoor, which provides range of products for use in outdoor activities; Marine, a manufacturer of recreational marine electronics; Aviation, which is a provider of solutions to aircraft manufacturers, existing aircraft owners and operators; Auto, which provides a range of products for use in the auto market.
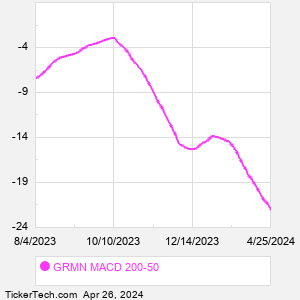
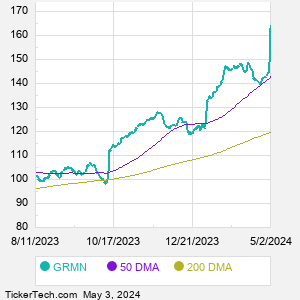
When researching a stock like Garmin, many investors are the most familiar with Fundamental Analysis — looking at a company's balance sheet, earnings, revenues, and what's happening in that company's underlying business. Investors who use Fundamental Analysis to identify good stocks to buy or sell can also benefit from GRMN Technical Analysis to help find a good entry or exit point. Technical Analysis is blind to the fundamentals and looks only at the trading data for GRMN stock — the real life supply and demand for the stock over time — and examines that data in different ways. One of those ways is to calculate a Simpe Moving Average ("SMA") by looking back a certain number of days. One of the most popular "longer look-backs" is the GRMN 200 day moving average ("GRMN 200 DMA"), while one of the most popular "shorter look-backs" is the GRMN 50 day moving average ("GRMN 50 DMA"). A chart showing both of these popular moving averages is shown on this page for Garmin. Comparing two moving averages against each other can be a useful visualization tool: by calculating the difference between the GRMN 200 DMA and the GRMN 50 DMA, we get a moving average convergence divergence indicator ("GRMN MACD"). The GRMN MACD chart, in conjunction with the chart of the moving averages, basically helps in visualizing how the moving averages are showing convergence (moving closer together), or divergence (moving farther apart). |