GS MACD


GS MACDGS DMA
Goldman Sachs Group is a bank holding company and financial holding company. Co. operates in four business segments: Investment Banking, which is engaged in financial advisory, underwriting and corporate lending activities; Global Markets, which consists of Fixed Income, Currency and Commodities and Equities, and engaged in intermediation and financing activities; Asset Management, which is engaged in the management, equity investments, lending and debt investments; and Consumer and Wealth Management, which consists of Wealth management and Consumer banking, and engaged in the management and other fees, incentive fees, private banking and lending, and consumer-oriented activities.

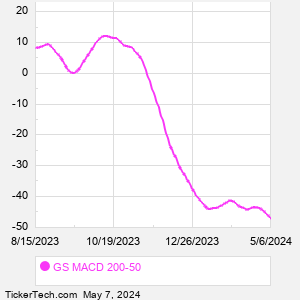
When researching a stock like Goldman Sachs Group, many investors are the most familiar with Fundamental Analysis — looking at a company's balance sheet, earnings, revenues, and what's happening in that company's underlying business. Investors who use Fundamental Analysis to identify good stocks to buy or sell can also benefit from GS Technical Analysis to help find a good entry or exit point. Technical Analysis is blind to the fundamentals and looks only at the trading data for GS stock — the real life supply and demand for the stock over time — and examines that data in different ways. One of those ways is to calculate a Simpe Moving Average ("SMA") by looking back a certain number of days. One of the most popular "longer look-backs" is the GS 200 day moving average ("GS 200 DMA"), while one of the most popular "shorter look-backs" is the GS 50 day moving average ("GS 50 DMA"). A chart showing both of these popular moving averages is shown on this page for Goldman Sachs Group. Comparing two moving averages against each other can be a useful visualization tool: by calculating the difference between the GS 200 DMA and the GS 50 DMA, we get a moving average convergence divergence indicator ("GS MACD"). The GS MACD chart, in conjunction with the chart of the moving averages, basically helps in visualizing how the moving averages are showing convergence (moving closer together), or divergence (moving farther apart).
10 Most Oversold S&P 500 Stocks
10 Most Overbought S&P 500 Stocks

10 ETFs With Stocks Insiders Are Buying
10 ETFs With Most Upside To Targets
The DividendRank Top 25
Warren Buffett Dividend Stocks
10 Cheap Dividend Stocks Under $10
10 Top DividendRank'ed Energy Stocks
The 10 Highest Yielding Preferred Stocks
The 15 Most Active S&P Call & Put Options
Quotes delayed 20 minutes

Email EnvelopeFree GS Email Alerts:
Get Dividend Alerts
Get SEC Filing Alerts
Video: Technical Analysis


If the video does not load after a few moments, Upgrade to the Latest Flash Player.
Goldman Sachs Group (GS) is categorized under the Financials sector; to help you further research MACD, below are some other companies in the same sector:

HBAN MACD
HIG MACD
HST MACD
HUM MACD
ICE MACD
INVH MACD
IVZ MACD
JPM MACD
KEY MACD
KIM MACD
More Financials companies »


GS MACD | www.StockMACD.com | Copyright © 2019 - 2024, All Rights Reserved

Nothing in StockMACD.com is intended to be investment advice, nor does it represent the opinion of, counsel from, or recommendations by BNK Invest Inc. or any of its affiliates, subsidiaries or partners. None of the information contained herein constitutes a recommendation that any particular security, portfolio, transaction, or investment strategy is suitable for any specific person. All viewers agree that under no circumstances will BNK Invest, Inc,. its subsidiaries, partners, officers, employees, affiliates, or agents be held liable for any loss or damage caused by your reliance on information obtained. By visiting, using or viewing this site, you agree to the following Full Disclaimer & Terms of Use and Privacy Policy. Video widget and market videos powered by Market News Video. Quote and option data delayed at least 15 minutes; stock quote data powered by Ticker Technologies, and Mergent.
X
Wait! Don't leave yet.
Want to receive our latest research absolutely free?


Click the button below for your complimentary copy of Your Early Retirement Portfolio: Dividends Up to 8.7%—Every Month—Forever.

You'll discover the details on 4 stocks and funds that pay you massive dividends as high as 8.7%.