Halliburton assists its customers throughout the lifecycle of the reservoir from locating hydrocarbons and managing geological data, to drilling and formation evaluation, well construction and completion and optimizing production throughout the life of the asset. Co.'s segments are: Completion and Production, which delivers cementing, stimulation, intervention, pressure control, artificial lift, and completion products and services; and Drilling and Evaluation, which provides field and reservoir modeling, drilling, fluids and specialty chemicals, evaluation and wellbore placement solutions that enable customers to model, measure, drill, and support their well construction activities.
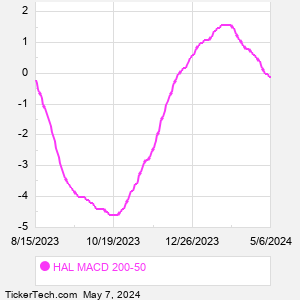
When researching a stock like Halliburton, many investors are the most familiar with Fundamental Analysis — looking at a company's balance sheet, earnings, revenues, and what's happening in that company's underlying business. Investors who use Fundamental Analysis to identify good stocks to buy or sell can also benefit from HAL Technical Analysis to help find a good entry or exit point. Technical Analysis is blind to the fundamentals and looks only at the trading data for HAL stock — the real life supply and demand for the stock over time — and examines that data in different ways. One of those ways is to calculate a Simpe Moving Average ("SMA") by looking back a certain number of days. One of the most popular "longer look-backs" is the HAL 200 day moving average ("HAL 200 DMA"), while one of the most popular "shorter look-backs" is the HAL 50 day moving average ("HAL 50 DMA"). A chart showing both of these popular moving averages is shown on this page for Halliburton. Comparing two moving averages against each other can be a useful visualization tool: by calculating the difference between the HAL 200 DMA and the HAL 50 DMA, we get a moving average convergence divergence indicator ("HAL MACD"). The HAL MACD chart, in conjunction with the chart of the moving averages, basically helps in visualizing how the moving averages are showing convergence (moving closer together), or divergence (moving farther apart). |