HCA Healthcare is a holding company. Through its subsidiaries and partnerships and joint ventures, Co. owns and operates hospitals and related health care entities. Co.'s general, acute care hospitals provide medical and surgical services, including inpatient care, intensive care, cardiac care, diagnostic services and emergency services. The general, acute care hospitals also provide outpatient services such as outpatient surgery, laboratory, radiology, respiratory therapy, cardiology and physical therapy. Co.'s psychiatric hospitals provide therapeutic programs, including child, adolescent and adult psychiatric care and adolescent and adult alcohol and drug abuse treatment and counseling.
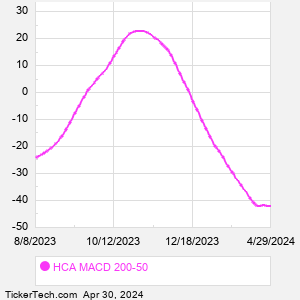
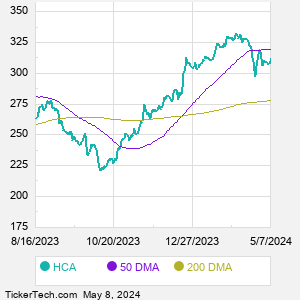
When researching a stock like HCA Healthcare, many investors are the most familiar with Fundamental Analysis — looking at a company's balance sheet, earnings, revenues, and what's happening in that company's underlying business. Investors who use Fundamental Analysis to identify good stocks to buy or sell can also benefit from HCA Technical Analysis to help find a good entry or exit point. Technical Analysis is blind to the fundamentals and looks only at the trading data for HCA stock — the real life supply and demand for the stock over time — and examines that data in different ways. One of those ways is to calculate a Simpe Moving Average ("SMA") by looking back a certain number of days. One of the most popular "longer look-backs" is the HCA 200 day moving average ("HCA 200 DMA"), while one of the most popular "shorter look-backs" is the HCA 50 day moving average ("HCA 50 DMA"). A chart showing both of these popular moving averages is shown on this page for HCA Healthcare. Comparing two moving averages against each other can be a useful visualization tool: by calculating the difference between the HCA 200 DMA and the HCA 50 DMA, we get a moving average convergence divergence indicator ("HCA MACD"). The HCA MACD chart, in conjunction with the chart of the moving averages, basically helps in visualizing how the moving averages are showing convergence (moving closer together), or divergence (moving farther apart). |