Honeywell International is a technology and manufacturing company. Co. has four segments: Aerospace, which supplies products, software and services for aircrafts; Honeywell Building Technologies, which provides products, software, solutions and technologies including building control and optimization, energy management, access control, video surveillance, fire products, and remote patient monitoring systems; Performance Materials and Technologies, which develops and manufactures chemicals and materials, process technologies and automation solutions; and Safety and Productivity Solutions, which provides products and software that improve productivity, workplace safety and asset performance.
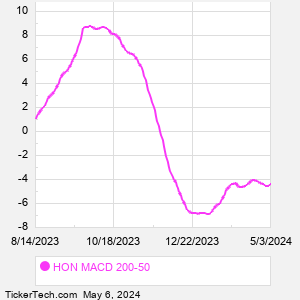
When researching a stock like Honeywell International, many investors are the most familiar with Fundamental Analysis — looking at a company's balance sheet, earnings, revenues, and what's happening in that company's underlying business. Investors who use Fundamental Analysis to identify good stocks to buy or sell can also benefit from HON Technical Analysis to help find a good entry or exit point. Technical Analysis is blind to the fundamentals and looks only at the trading data for HON stock — the real life supply and demand for the stock over time — and examines that data in different ways. One of those ways is to calculate a Simpe Moving Average ("SMA") by looking back a certain number of days. One of the most popular "longer look-backs" is the HON 200 day moving average ("HON 200 DMA"), while one of the most popular "shorter look-backs" is the HON 50 day moving average ("HON 50 DMA"). A chart showing both of these popular moving averages is shown on this page for Honeywell International. Comparing two moving averages against each other can be a useful visualization tool: by calculating the difference between the HON 200 DMA and the HON 50 DMA, we get a moving average convergence divergence indicator ("HON MACD"). The HON MACD chart, in conjunction with the chart of the moving averages, basically helps in visualizing how the moving averages are showing convergence (moving closer together), or divergence (moving farther apart). |