H&R Block provides assisted, do-it-yourself tax return preparation solutions through multiple channels and distributes H&R Block-branded services and products, including those of its bank partners, to the general public in the U.S., Canada and Australia. Co. also provides a number of additional services, including Refund Transfers, Co.'s Peace of Mind® Extended Service Plan (POM), H&R Block Emerald Prepaid Mastercard®, Emerald Advances, Tax Identity Shield®, Refund Advances, and small business financial solutions. For its Canadian clients, Co. also provides POM, H&R Block's Instant Refundsm, H&R Block Pay With Refund®, and small business financial solutions.
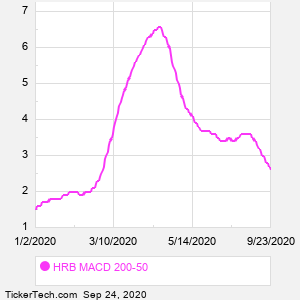
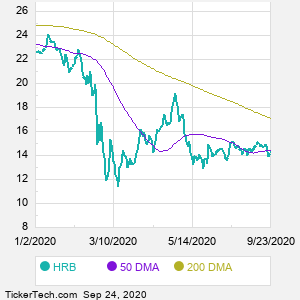
When researching a stock like H and R Block, many investors are the most familiar with Fundamental Analysis — looking at a company's balance sheet, earnings, revenues, and what's happening in that company's underlying business. Investors who use Fundamental Analysis to identify good stocks to buy or sell can also benefit from HRB Technical Analysis to help find a good entry or exit point. Technical Analysis is blind to the fundamentals and looks only at the trading data for HRB stock — the real life supply and demand for the stock over time — and examines that data in different ways. One of those ways is to calculate a Simpe Moving Average ("SMA") by looking back a certain number of days. One of the most popular "longer look-backs" is the HRB 200 day moving average ("HRB 200 DMA"), while one of the most popular "shorter look-backs" is the HRB 50 day moving average ("HRB 50 DMA"). A chart showing both of these popular moving averages is shown on this page for H and R Block. Comparing two moving averages against each other can be a useful visualization tool: by calculating the difference between the HRB 200 DMA and the HRB 50 DMA, we get a moving average convergence divergence indicator ("HRB MACD"). The HRB MACD chart, in conjunction with the chart of the moving averages, basically helps in visualizing how the moving averages are showing convergence (moving closer together), or divergence (moving farther apart). |