International Business Machines provides solutions and products that utilize data, information technology, capability in industries and business processes. Co. has four business segments: Software, which provides software solutions that address client needs for a hybrid cloud platform, data and AI, automation, and security; Consulting, which provides knowledge and capabilities in business transformation and technology implementation; Infrastructure, which provides solutions for hybrid cloud and is the foundation of the hybrid cloud stack; and Financing, which facilitates its clients' acquisition of information technology systems, software and services through its financing solutions.
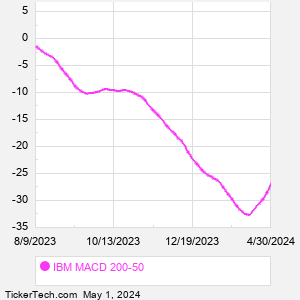
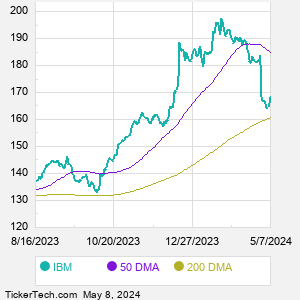
When researching a stock like International Business Machines, many investors are the most familiar with Fundamental Analysis — looking at a company's balance sheet, earnings, revenues, and what's happening in that company's underlying business. Investors who use Fundamental Analysis to identify good stocks to buy or sell can also benefit from IBM Technical Analysis to help find a good entry or exit point. Technical Analysis is blind to the fundamentals and looks only at the trading data for IBM stock — the real life supply and demand for the stock over time — and examines that data in different ways. One of those ways is to calculate a Simpe Moving Average ("SMA") by looking back a certain number of days. One of the most popular "longer look-backs" is the IBM 200 day moving average ("IBM 200 DMA"), while one of the most popular "shorter look-backs" is the IBM 50 day moving average ("IBM 50 DMA"). A chart showing both of these popular moving averages is shown on this page for International Business Machines. Comparing two moving averages against each other can be a useful visualization tool: by calculating the difference between the IBM 200 DMA and the IBM 50 DMA, we get a moving average convergence divergence indicator ("IBM MACD"). The IBM MACD chart, in conjunction with the chart of the moving averages, basically helps in visualizing how the moving averages are showing convergence (moving closer together), or divergence (moving farther apart). |