Intercontinental Exchange is a holding company. Through its subsidiaries, Co. provides market infrastructure, data services and technology solutions. Co.'s segments are: Exchanges, which operates regulated marketplaces for the listing, trading and clearing of derivatives contracts and financial securities, such as commodities, interest rates, foreign exchange and equities; Fixed Income and Data Services, which includes fixed income data and analytics offerings, fixed income execution, credit default swaps clearing and other multi-asset class data and network services; and Mortgage Technology, which includes origination technology, closing solutions, data and analytics, and other services.
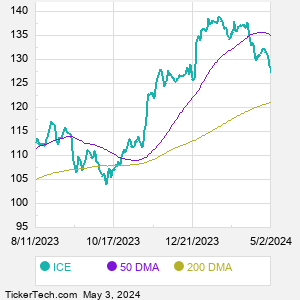
When researching a stock like Intercontinental Exchange, many investors are the most familiar with Fundamental Analysis — looking at a company's balance sheet, earnings, revenues, and what's happening in that company's underlying business. Investors who use Fundamental Analysis to identify good stocks to buy or sell can also benefit from ICE Technical Analysis to help find a good entry or exit point. Technical Analysis is blind to the fundamentals and looks only at the trading data for ICE stock — the real life supply and demand for the stock over time — and examines that data in different ways. One of those ways is to calculate a Simpe Moving Average ("SMA") by looking back a certain number of days. One of the most popular "longer look-backs" is the ICE 200 day moving average ("ICE 200 DMA"), while one of the most popular "shorter look-backs" is the ICE 50 day moving average ("ICE 50 DMA"). A chart showing both of these popular moving averages is shown on this page for Intercontinental Exchange. Comparing two moving averages against each other can be a useful visualization tool: by calculating the difference between the ICE 200 DMA and the ICE 50 DMA, we get a moving average convergence divergence indicator ("ICE MACD"). The ICE MACD chart, in conjunction with the chart of the moving averages, basically helps in visualizing how the moving averages are showing convergence (moving closer together), or divergence (moving farther apart). |