Illumina is engaged in sequencing- and array-based solutions for genetic and genomic analysis. Co.'s products and services enable the adoption of genomic solutions in research and clinical settings. Co.'s principal products, services, and technologies are: sequencing, which includes Deoxyribonucleic acid (DNA) sequencing, a process of determining the order of nucleotide bases (A, C, G, or T) in a DNA sample; arrays, which are used for a range of DNA and RNA analysis applications; consumables, which Co. has developed various library preparation and sequencing kits; and services, which provides whole-genome sequencing, genotyping, noninvasive prenatal testing, and product support services.
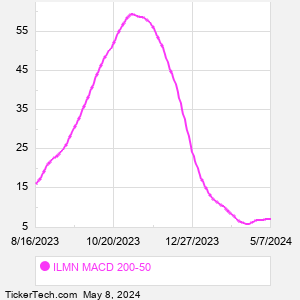
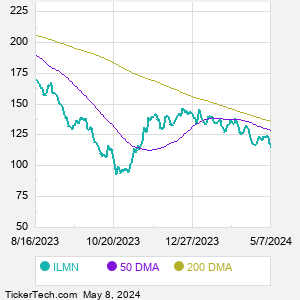
When researching a stock like Illumina, many investors are the most familiar with Fundamental Analysis — looking at a company's balance sheet, earnings, revenues, and what's happening in that company's underlying business. Investors who use Fundamental Analysis to identify good stocks to buy or sell can also benefit from ILMN Technical Analysis to help find a good entry or exit point. Technical Analysis is blind to the fundamentals and looks only at the trading data for ILMN stock — the real life supply and demand for the stock over time — and examines that data in different ways. One of those ways is to calculate a Simpe Moving Average ("SMA") by looking back a certain number of days. One of the most popular "longer look-backs" is the ILMN 200 day moving average ("ILMN 200 DMA"), while one of the most popular "shorter look-backs" is the ILMN 50 day moving average ("ILMN 50 DMA"). A chart showing both of these popular moving averages is shown on this page for Illumina. Comparing two moving averages against each other can be a useful visualization tool: by calculating the difference between the ILMN 200 DMA and the ILMN 50 DMA, we get a moving average convergence divergence indicator ("ILMN MACD"). The ILMN MACD chart, in conjunction with the chart of the moving averages, basically helps in visualizing how the moving averages are showing convergence (moving closer together), or divergence (moving farther apart). |