Intel provides end-to-end solutions, scaling from edge computing to 5G networks, the cloud, and the emerging fields of Artificial intelligence and autonomous driving. Co.'s segments are: Client Computing Group, which focuses on long-term operating system, system architecture, hardware, and application integration; Data Center Group and AI, which delivers workload-optimized solutions; Network and Edge, which delivers and deploys intelligent edge platforms; Mobileye, which provides driving assistance and self-driving solutions; Accelerated Computing Systems and Graphics, which solves the computational problems; and Intel Foundry Services.
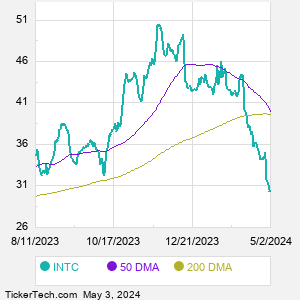
When researching a stock like Intel, many investors are the most familiar with Fundamental Analysis — looking at a company's balance sheet, earnings, revenues, and what's happening in that company's underlying business. Investors who use Fundamental Analysis to identify good stocks to buy or sell can also benefit from INTC Technical Analysis to help find a good entry or exit point. Technical Analysis is blind to the fundamentals and looks only at the trading data for INTC stock — the real life supply and demand for the stock over time — and examines that data in different ways. One of those ways is to calculate a Simpe Moving Average ("SMA") by looking back a certain number of days. One of the most popular "longer look-backs" is the INTC 200 day moving average ("INTC 200 DMA"), while one of the most popular "shorter look-backs" is the INTC 50 day moving average ("INTC 50 DMA"). A chart showing both of these popular moving averages is shown on this page for Intel. Comparing two moving averages against each other can be a useful visualization tool: by calculating the difference between the INTC 200 DMA and the INTC 50 DMA, we get a moving average convergence divergence indicator ("INTC MACD"). The INTC MACD chart, in conjunction with the chart of the moving averages, basically helps in visualizing how the moving averages are showing convergence (moving closer together), or divergence (moving farther apart). |