Interpublic Group of Companies is an advertising and marketing services company. Co. engages in consumer advertising, digital marketing, communications planning and media buying, public relations, communications disciplines and data management. Co. has two reportable segments, which are Integrated Agency Networks (IAN) and IPG DXTRA (DXTRA). Within IAN, Co.'s agencies provide a range of communications and marketing services. Co.'s digital specialist agencies provide digital capabilities and serve as primary digital partners. DXTRA provides clients with public relations, meeting and event production, sports and entertainment marketing, corporate and brand identity, and marketing consulting.
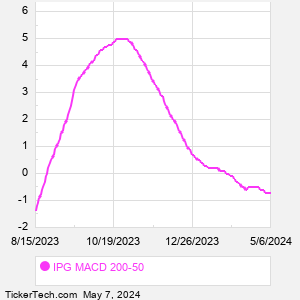
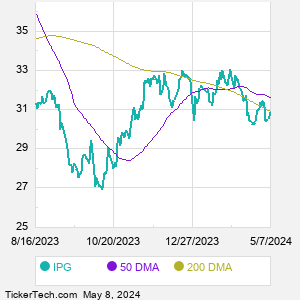
When researching a stock like Interpublic Group of Companies, many investors are the most familiar with Fundamental Analysis — looking at a company's balance sheet, earnings, revenues, and what's happening in that company's underlying business. Investors who use Fundamental Analysis to identify good stocks to buy or sell can also benefit from IPG Technical Analysis to help find a good entry or exit point. Technical Analysis is blind to the fundamentals and looks only at the trading data for IPG stock — the real life supply and demand for the stock over time — and examines that data in different ways. One of those ways is to calculate a Simpe Moving Average ("SMA") by looking back a certain number of days. One of the most popular "longer look-backs" is the IPG 200 day moving average ("IPG 200 DMA"), while one of the most popular "shorter look-backs" is the IPG 50 day moving average ("IPG 50 DMA"). A chart showing both of these popular moving averages is shown on this page for Interpublic Group of Companies. Comparing two moving averages against each other can be a useful visualization tool: by calculating the difference between the IPG 200 DMA and the IPG 50 DMA, we get a moving average convergence divergence indicator ("IPG MACD"). The IPG MACD chart, in conjunction with the chart of the moving averages, basically helps in visualizing how the moving averages are showing convergence (moving closer together), or divergence (moving farther apart). |