Gartner is a trusted advisor. Co.'s segments are: Research, which delivers advice to leaders across an enterprise through subscription services that include on-demand access to published research content, data and benchmarks, and direct access to a network of research personnel located around the globe; Conferences, which is designed for information technology and business executives as well as decision makers looking to adapt and evolve their organizations through disruption and uncertainty, navigate risks and prioritize investments; and Consulting, which combines its research with custom analysis and on-the-ground support to help clients to turn insight and advice into action and impact.
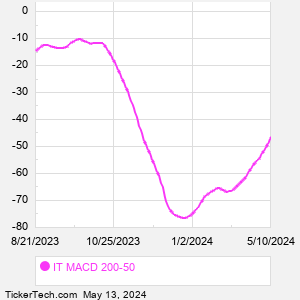
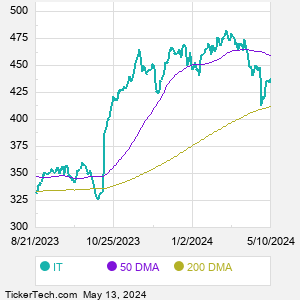
When researching a stock like Gartner, many investors are the most familiar with Fundamental Analysis — looking at a company's balance sheet, earnings, revenues, and what's happening in that company's underlying business. Investors who use Fundamental Analysis to identify good stocks to buy or sell can also benefit from IT Technical Analysis to help find a good entry or exit point. Technical Analysis is blind to the fundamentals and looks only at the trading data for IT stock — the real life supply and demand for the stock over time — and examines that data in different ways. One of those ways is to calculate a Simpe Moving Average ("SMA") by looking back a certain number of days. One of the most popular "longer look-backs" is the IT 200 day moving average ("IT 200 DMA"), while one of the most popular "shorter look-backs" is the IT 50 day moving average ("IT 50 DMA"). A chart showing both of these popular moving averages is shown on this page for Gartner. Comparing two moving averages against each other can be a useful visualization tool: by calculating the difference between the IT 200 DMA and the IT 50 DMA, we get a moving average convergence divergence indicator ("IT MACD"). The IT MACD chart, in conjunction with the chart of the moving averages, basically helps in visualizing how the moving averages are showing convergence (moving closer together), or divergence (moving farther apart). |