CarMax is a holding company. Through its subsidiaries, Co. is engaged as a retailer of used vehicles. Co. operates in two reportable segments: CarMax Sales Operations and CarMax Auto Finance (CAF). Co.'s CarMax Sales Operations segment sells used vehicles, purchases used vehicles from customers and other sources, sells related products and services, and arranges financing options. CAF provides financing solely to customers buying retail vehicles from Co. CAF also services various auto loans it originates and is responsible for providing billing statements, collecting payments, maintaining contact with customers, and arranging for the repossession of vehicles securing defaulted loans.
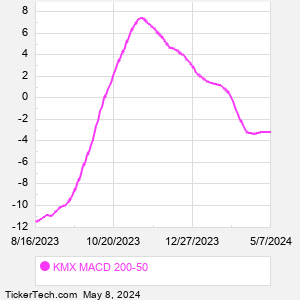
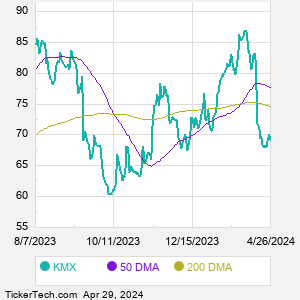
When researching a stock like Carmax, many investors are the most familiar with Fundamental Analysis — looking at a company's balance sheet, earnings, revenues, and what's happening in that company's underlying business. Investors who use Fundamental Analysis to identify good stocks to buy or sell can also benefit from KMX Technical Analysis to help find a good entry or exit point. Technical Analysis is blind to the fundamentals and looks only at the trading data for KMX stock — the real life supply and demand for the stock over time — and examines that data in different ways. One of those ways is to calculate a Simpe Moving Average ("SMA") by looking back a certain number of days. One of the most popular "longer look-backs" is the KMX 200 day moving average ("KMX 200 DMA"), while one of the most popular "shorter look-backs" is the KMX 50 day moving average ("KMX 50 DMA"). A chart showing both of these popular moving averages is shown on this page for Carmax. Comparing two moving averages against each other can be a useful visualization tool: by calculating the difference between the KMX 200 DMA and the KMX 50 DMA, we get a moving average convergence divergence indicator ("KMX MACD"). The KMX MACD chart, in conjunction with the chart of the moving averages, basically helps in visualizing how the moving averages are showing convergence (moving closer together), or divergence (moving farther apart). |