Loews is a holding company and has four reportable segments comprised of three individual operating subsidiaries: CNA Financial Corporation, which provides commercial property and casualty coverages, including surety; Boardwalk Pipeline Partners, LP, which is engaged in the business of transportation and storage of natural gas and natural gas liquids and hydrocarbons; Loews Hotels Holding Corporation, which operates a chain of hotels; and the Corporate segment.
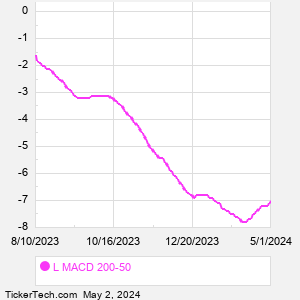
When researching a stock like Loews, many investors are the most familiar with Fundamental Analysis — looking at a company's balance sheet, earnings, revenues, and what's happening in that company's underlying business. Investors who use Fundamental Analysis to identify good stocks to buy or sell can also benefit from L Technical Analysis to help find a good entry or exit point. Technical Analysis is blind to the fundamentals and looks only at the trading data for L stock — the real life supply and demand for the stock over time — and examines that data in different ways. One of those ways is to calculate a Simpe Moving Average ("SMA") by looking back a certain number of days. One of the most popular "longer look-backs" is the L 200 day moving average ("L 200 DMA"), while one of the most popular "shorter look-backs" is the L 50 day moving average ("L 50 DMA"). A chart showing both of these popular moving averages is shown on this page for Loews. Comparing two moving averages against each other can be a useful visualization tool: by calculating the difference between the L 200 DMA and the L 50 DMA, we get a moving average convergence divergence indicator ("L MACD"). The L MACD chart, in conjunction with the chart of the moving averages, basically helps in visualizing how the moving averages are showing convergence (moving closer together), or divergence (moving farther apart). |