Leggett & Platt is a manufacturer that conceives, designs, and produces a range of engineered components and products found in various homes and automobiles. Co.'s segments include: Bedding Products, which manufactures steel coil bedsprings; Specialized Products, which designs, manufactures, and sells products including automotive comfort and convenience systems, tubing and fabricated assemblies for the aerospace industry; and Furniture, Flooring and Textile Products, which designs, manufactures, and distributes a range of components and finished products for residential and commercial markets, and select markets for structural fabrics and geo components.
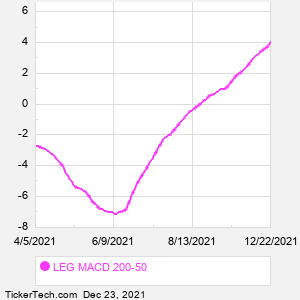
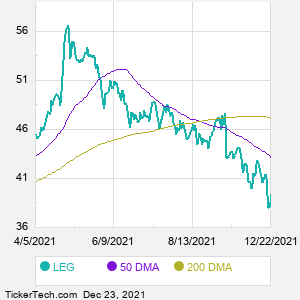
When researching a stock like Leggett and Platt, many investors are the most familiar with Fundamental Analysis — looking at a company's balance sheet, earnings, revenues, and what's happening in that company's underlying business. Investors who use Fundamental Analysis to identify good stocks to buy or sell can also benefit from LEG Technical Analysis to help find a good entry or exit point. Technical Analysis is blind to the fundamentals and looks only at the trading data for LEG stock — the real life supply and demand for the stock over time — and examines that data in different ways. One of those ways is to calculate a Simpe Moving Average ("SMA") by looking back a certain number of days. One of the most popular "longer look-backs" is the LEG 200 day moving average ("LEG 200 DMA"), while one of the most popular "shorter look-backs" is the LEG 50 day moving average ("LEG 50 DMA"). A chart showing both of these popular moving averages is shown on this page for Leggett and Platt. Comparing two moving averages against each other can be a useful visualization tool: by calculating the difference between the LEG 200 DMA and the LEG 50 DMA, we get a moving average convergence divergence indicator ("LEG MACD"). The LEG MACD chart, in conjunction with the chart of the moving averages, basically helps in visualizing how the moving averages are showing convergence (moving closer together), or divergence (moving farther apart). |