| LH MACD Data | ||||||||||
Also see: |


| LH MACD Chart |
  |
| About Laboratory Corporation of America Holdings |
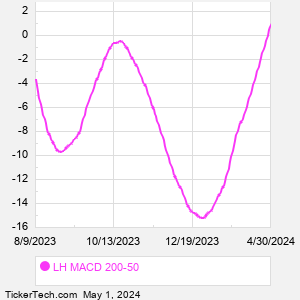
| Laboratory Corporation of America Holdings is a global life sciences company that provides vital information to help doctors, hospitals, pharmaceutical companies, researchers, and patients make decisions. Co. reports its business in two segments, LabCorp Diagnostics (Dx) and Labcorp Drug Development (DD). Dx is an independent clinical laboratory business. Co. provides a menu of frequently requested primary testing and specialty testing through a network of primary and specialty laboratories across the U.S. DD provides end-to-end drug development, medical device and companion diagnostic development solutions from early-stage research to clinical development and commercial market access. When researching a stock like Laboratory of America Holdings, many investors are the most familiar with Fundamental Analysis — looking at a company's balance sheet, earnings, revenues, and what's happening in that company's underlying business. Investors who use Fundamental Analysis to identify good stocks to buy or sell can also benefit from LH Technical Analysis to help find a good entry or exit point. Technical Analysis is blind to the fundamentals and looks only at the trading data for LH stock — the real life supply and demand for the stock over time — and examines that data in different ways. One of those ways is to calculate a Simpe Moving Average ("SMA") by looking back a certain number of days. One of the most popular "longer look-backs" is the LH 200 day moving average ("LH 200 DMA"), while one of the most popular "shorter look-backs" is the LH 50 day moving average ("LH 50 DMA"). A chart showing both of these popular moving averages is shown on this page for Laboratory of America Holdings. Comparing two moving averages against each other can be a useful visualization tool: by calculating the difference between the LH 200 DMA and the LH 50 DMA, we get a moving average convergence divergence indicator ("LH MACD"). The LH MACD chart, in conjunction with the chart of the moving averages, basically helps in visualizing how the moving averages are showing convergence (moving closer together), or divergence (moving farther apart). |
| LH Current Stock Quote |
Get Dividend Alerts Get SEC Filing Alerts |
| LH Stock Price Chart |
| Video: Technical Analysis | |
|
| LH MACD Peers |
| Laboratory of America Holdings (LH) is categorized under the Healthcare sector; to help you further research MACD, below are some other companies in the same sector:
LLY MACD |