Mastercard is a technology company that connects consumers, financial institutions, merchants, governments, digital partners, businesses and other organizations by enabling electronic payments instead of cash and checks. Co.'s payment products and applications include: consumer payment products, which includes consumer credit, consumer debit and prepaid; and new payment flows, which includes disbursements and remittances, commercial point of sale, business-to-business accounts payable and consumer bill payments. Co.'s services include: cyber and intelligence solutions, which prevents, detects and responds to fraud and cyber-attacks; data and services solutions; and processing and gateway.
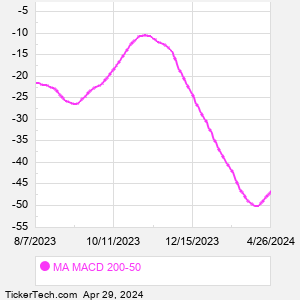
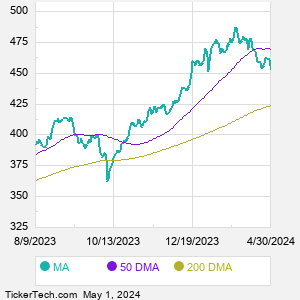
When researching a stock like Mastercard, many investors are the most familiar with Fundamental Analysis — looking at a company's balance sheet, earnings, revenues, and what's happening in that company's underlying business. Investors who use Fundamental Analysis to identify good stocks to buy or sell can also benefit from MA Technical Analysis to help find a good entry or exit point. Technical Analysis is blind to the fundamentals and looks only at the trading data for MA stock — the real life supply and demand for the stock over time — and examines that data in different ways. One of those ways is to calculate a Simpe Moving Average ("SMA") by looking back a certain number of days. One of the most popular "longer look-backs" is the MA 200 day moving average ("MA 200 DMA"), while one of the most popular "shorter look-backs" is the MA 50 day moving average ("MA 50 DMA"). A chart showing both of these popular moving averages is shown on this page for Mastercard. Comparing two moving averages against each other can be a useful visualization tool: by calculating the difference between the MA 200 DMA and the MA 50 DMA, we get a moving average convergence divergence indicator ("MA MACD"). The MA MACD chart, in conjunction with the chart of the moving averages, basically helps in visualizing how the moving averages are showing convergence (moving closer together), or divergence (moving farther apart). |