MetLife is an insurance holding company. Through its subsidiaries and affiliates, Co. is a financial services company, providing insurance, annuities, employee benefits and asset management. Co. is organized into five segments: U.S.; Asia; Latin America; Europe, the Middle East and Africa; and MetLife Holdings. In the U.S., Co. provides a variety of insurance and financial services products, including life, dental, disability, vision, accident and health, capital market investment, risk solutions, stable value and annuities. Outside the U.S., Co. provides life, accident and health and credit insurance, as well as retirement and savings products.
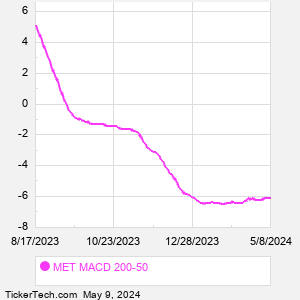
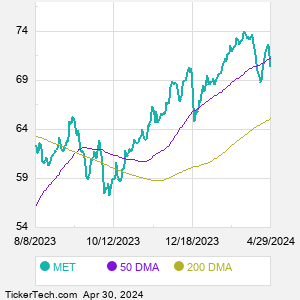
When researching a stock like MetLife, many investors are the most familiar with Fundamental Analysis — looking at a company's balance sheet, earnings, revenues, and what's happening in that company's underlying business. Investors who use Fundamental Analysis to identify good stocks to buy or sell can also benefit from MET Technical Analysis to help find a good entry or exit point. Technical Analysis is blind to the fundamentals and looks only at the trading data for MET stock — the real life supply and demand for the stock over time — and examines that data in different ways. One of those ways is to calculate a Simpe Moving Average ("SMA") by looking back a certain number of days. One of the most popular "longer look-backs" is the MET 200 day moving average ("MET 200 DMA"), while one of the most popular "shorter look-backs" is the MET 50 day moving average ("MET 50 DMA"). A chart showing both of these popular moving averages is shown on this page for MetLife. Comparing two moving averages against each other can be a useful visualization tool: by calculating the difference between the MET 200 DMA and the MET 50 DMA, we get a moving average convergence divergence indicator ("MET MACD"). The MET MACD chart, in conjunction with the chart of the moving averages, basically helps in visualizing how the moving averages are showing convergence (moving closer together), or divergence (moving farther apart). |