NIKE is engaged in the design, development and marketing and selling of athletic footwear, apparel, equipment, accessories and services. Co.'s NIKE Brand product offerings are aligned around its consumer construct focused on Men's, Women's and Kids'. Co. also designs products for the Jordan Brand and Converse. Co. sells athletic footwear and sports apparel products, which are designed primarily for athletic use, although a number of the products are worn for casual or leisure purposes. Co. also sells performance equipment and accessories under the NIKE Brand name, including bags, socks, sport balls, eyewear, timepieces, digital devices, and other equipment designed for sports activities.
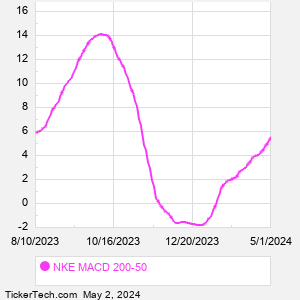
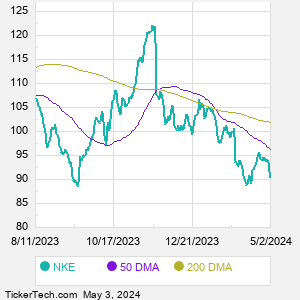
When researching a stock like Nike, many investors are the most familiar with Fundamental Analysis — looking at a company's balance sheet, earnings, revenues, and what's happening in that company's underlying business. Investors who use Fundamental Analysis to identify good stocks to buy or sell can also benefit from NKE Technical Analysis to help find a good entry or exit point. Technical Analysis is blind to the fundamentals and looks only at the trading data for NKE stock — the real life supply and demand for the stock over time — and examines that data in different ways. One of those ways is to calculate a Simpe Moving Average ("SMA") by looking back a certain number of days. One of the most popular "longer look-backs" is the NKE 200 day moving average ("NKE 200 DMA"), while one of the most popular "shorter look-backs" is the NKE 50 day moving average ("NKE 50 DMA"). A chart showing both of these popular moving averages is shown on this page for Nike. Comparing two moving averages against each other can be a useful visualization tool: by calculating the difference between the NKE 200 DMA and the NKE 50 DMA, we get a moving average convergence divergence indicator ("NKE MACD"). The NKE MACD chart, in conjunction with the chart of the moving averages, basically helps in visualizing how the moving averages are showing convergence (moving closer together), or divergence (moving farther apart). |