Northrop Grumman Corporation is a leading global security company providing innovative systems, products and solutions in aerospace, electronics, information systems, and technical services to government and commercial customers worldwide. The company's core competencies are aligned with the current and future needs of their customers and address emerging global security challenges in key areas, such as unmanned systems, cybersecurity, C4ISR, and logistics that are critical to the defense of the United States and its allies.
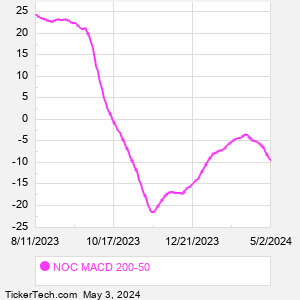
When researching a stock like Northrop Grumman, many investors are the most familiar with Fundamental Analysis — looking at a company's balance sheet, earnings, revenues, and what's happening in that company's underlying business. Investors who use Fundamental Analysis to identify good stocks to buy or sell can also benefit from NOC Technical Analysis to help find a good entry or exit point. Technical Analysis is blind to the fundamentals and looks only at the trading data for NOC stock — the real life supply and demand for the stock over time — and examines that data in different ways. One of those ways is to calculate a Simpe Moving Average ("SMA") by looking back a certain number of days. One of the most popular "longer look-backs" is the NOC 200 day moving average ("NOC 200 DMA"), while one of the most popular "shorter look-backs" is the NOC 50 day moving average ("NOC 50 DMA"). A chart showing both of these popular moving averages is shown on this page for Northrop Grumman. Comparing two moving averages against each other can be a useful visualization tool: by calculating the difference between the NOC 200 DMA and the NOC 50 DMA, we get a moving average convergence divergence indicator ("NOC MACD"). The NOC MACD chart, in conjunction with the chart of the moving averages, basically helps in visualizing how the moving averages are showing convergence (moving closer together), or divergence (moving farther apart). |