National Oilwell Varco is an independent provider of equipment and technology to the upstream oil and gas industry. Co.'s segments include: Wellbore Technologies, which designs, manufactures, rents, and sells equipment and technologies for drilling operations; Completion and Production Solutions, which designs, manufactures, and services equipment and technologies for hydraulic fracture stimulation, well intervention, well construction, onshore production, and offshore production; and Rig Technologies, which designs, manufactures and sells land rigs, offshore drilling equipment packages, and drilling rig components that mechanize and automate the drilling process and rig functionality.
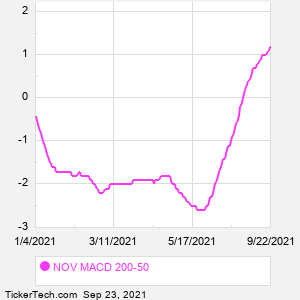
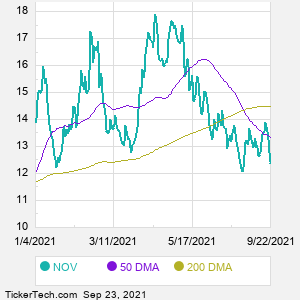
When researching a stock like National Oilwell Varco, many investors are the most familiar with Fundamental Analysis — looking at a company's balance sheet, earnings, revenues, and what's happening in that company's underlying business. Investors who use Fundamental Analysis to identify good stocks to buy or sell can also benefit from NOV Technical Analysis to help find a good entry or exit point. Technical Analysis is blind to the fundamentals and looks only at the trading data for NOV stock — the real life supply and demand for the stock over time — and examines that data in different ways. One of those ways is to calculate a Simpe Moving Average ("SMA") by looking back a certain number of days. One of the most popular "longer look-backs" is the NOV 200 day moving average ("NOV 200 DMA"), while one of the most popular "shorter look-backs" is the NOV 50 day moving average ("NOV 50 DMA"). A chart showing both of these popular moving averages is shown on this page for National Oilwell Varco. Comparing two moving averages against each other can be a useful visualization tool: by calculating the difference between the NOV 200 DMA and the NOV 50 DMA, we get a moving average convergence divergence indicator ("NOV MACD"). The NOV MACD chart, in conjunction with the chart of the moving averages, basically helps in visualizing how the moving averages are showing convergence (moving closer together), or divergence (moving farther apart). |