NXP Semiconductors is a holding company. Through its subsidiaries, Co. is engaged as a semiconductor company. Co.'s product solutions are used in a range of end-market applications including: automotive, industrial and Internet of Things, mobile, and communication infrastructure. Co. is engaged with global original equipment manufacturers and sells products in various primary geographic regions. Co. provides customers a portfolio of semiconductor products including microcontrollers, application processors, communication processors, connectivity chipsets, analog and interface devices, radio frequency power amplifiers, security controllers and sensors.
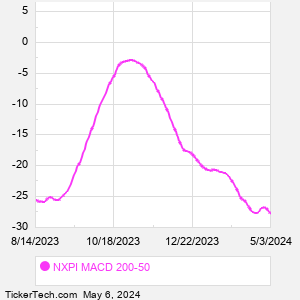
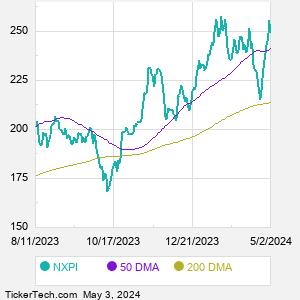
When researching a stock like NXP Semiconductors NV, many investors are the most familiar with Fundamental Analysis — looking at a company's balance sheet, earnings, revenues, and what's happening in that company's underlying business. Investors who use Fundamental Analysis to identify good stocks to buy or sell can also benefit from NXPI Technical Analysis to help find a good entry or exit point. Technical Analysis is blind to the fundamentals and looks only at the trading data for NXPI stock — the real life supply and demand for the stock over time — and examines that data in different ways. One of those ways is to calculate a Simpe Moving Average ("SMA") by looking back a certain number of days. One of the most popular "longer look-backs" is the NXPI 200 day moving average ("NXPI 200 DMA"), while one of the most popular "shorter look-backs" is the NXPI 50 day moving average ("NXPI 50 DMA"). A chart showing both of these popular moving averages is shown on this page for NXP Semiconductors NV. Comparing two moving averages against each other can be a useful visualization tool: by calculating the difference between the NXPI 200 DMA and the NXPI 50 DMA, we get a moving average convergence divergence indicator ("NXPI MACD"). The NXPI MACD chart, in conjunction with the chart of the moving averages, basically helps in visualizing how the moving averages are showing convergence (moving closer together), or divergence (moving farther apart). |