Old Dominion Freight Line is a less-than-truckload (LTL) motor carrier. Co. provides regional, inter-regional and national LTL services through a single integrated, union-free organization. Co.'s service offerings, which include expedited transportation, are provided through a network of service centers located throughout the continental U.S. Through alliances, Co. also provides LTL services throughout North America. In addition to its LTL services, Co. provides a range of services including container drayage, truckload brokerage and supply chain consulting.
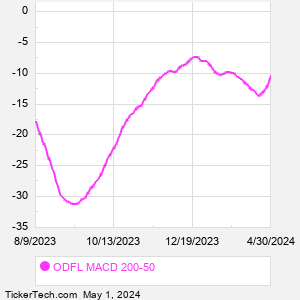
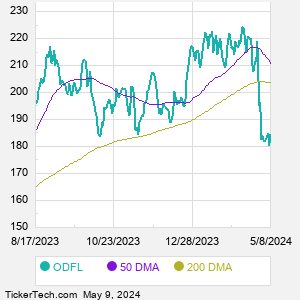
When researching a stock like Old Dominion Freight Line, many investors are the most familiar with Fundamental Analysis — looking at a company's balance sheet, earnings, revenues, and what's happening in that company's underlying business. Investors who use Fundamental Analysis to identify good stocks to buy or sell can also benefit from ODFL Technical Analysis to help find a good entry or exit point. Technical Analysis is blind to the fundamentals and looks only at the trading data for ODFL stock — the real life supply and demand for the stock over time — and examines that data in different ways. One of those ways is to calculate a Simpe Moving Average ("SMA") by looking back a certain number of days. One of the most popular "longer look-backs" is the ODFL 200 day moving average ("ODFL 200 DMA"), while one of the most popular "shorter look-backs" is the ODFL 50 day moving average ("ODFL 50 DMA"). A chart showing both of these popular moving averages is shown on this page for Old Dominion Freight Line. Comparing two moving averages against each other can be a useful visualization tool: by calculating the difference between the ODFL 200 DMA and the ODFL 50 DMA, we get a moving average convergence divergence indicator ("ODFL MACD"). The ODFL MACD chart, in conjunction with the chart of the moving averages, basically helps in visualizing how the moving averages are showing convergence (moving closer together), or divergence (moving farther apart). |