Organon & Co. is a health care company, focused on improving the health of women throughout their lives. Co. develops and delivers health solutions through a portfolio of prescription therapies within women's health, biosimilars and established brands. Co. has a portfolio of medicines and products across a range of therapeutic areas. Co. sells these products through various channels including drug wholesalers and retailers, hospitals, government agencies and managed health care providers such as health maintenance organizations, pharmacy benefit managers and other institutions. Co. operates manufacturing facilities located in Belgium, Brazil, Indonesia, Mexico, the Netherlands and the U.K.
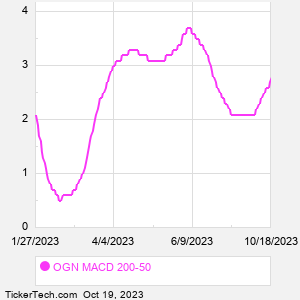
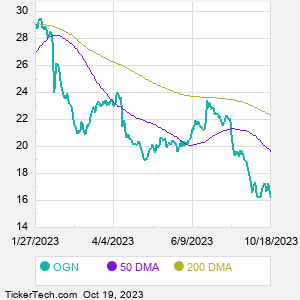
When researching a stock like Organon, many investors are the most familiar with Fundamental Analysis — looking at a company's balance sheet, earnings, revenues, and what's happening in that company's underlying business. Investors who use Fundamental Analysis to identify good stocks to buy or sell can also benefit from OGN Technical Analysis to help find a good entry or exit point. Technical Analysis is blind to the fundamentals and looks only at the trading data for OGN stock — the real life supply and demand for the stock over time — and examines that data in different ways. One of those ways is to calculate a Simpe Moving Average ("SMA") by looking back a certain number of days. One of the most popular "longer look-backs" is the OGN 200 day moving average ("OGN 200 DMA"), while one of the most popular "shorter look-backs" is the OGN 50 day moving average ("OGN 50 DMA"). A chart showing both of these popular moving averages is shown on this page for Organon. Comparing two moving averages against each other can be a useful visualization tool: by calculating the difference between the OGN 200 DMA and the OGN 50 DMA, we get a moving average convergence divergence indicator ("OGN MACD"). The OGN MACD chart, in conjunction with the chart of the moving averages, basically helps in visualizing how the moving averages are showing convergence (moving closer together), or divergence (moving farther apart). |