Oneok is a midstream service provider and owns natural gas liquids systems, connecting natural gas liquid (NGL) supply in the Rocky Mountain, Permian and Mid-Continent regions with key market centers and owns a network of natural gas gathering, processing, storage and transportation assets. Co. operates in the following business segments: Natural Gas Gathering and Processing, which provides midstream services to producers; NGLs, which owns and operates facilities that gather, fractionate, treat and distribute NGLs and store NGL products; and Natural Gas Pipelines, which provides intrastate and interstate natural gas transportation and storage services to end users.
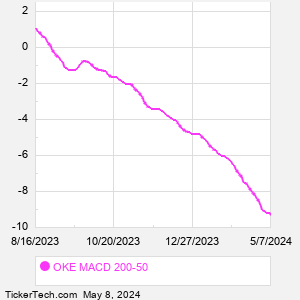
When researching a stock like ONEOK, many investors are the most familiar with Fundamental Analysis — looking at a company's balance sheet, earnings, revenues, and what's happening in that company's underlying business. Investors who use Fundamental Analysis to identify good stocks to buy or sell can also benefit from OKE Technical Analysis to help find a good entry or exit point. Technical Analysis is blind to the fundamentals and looks only at the trading data for OKE stock — the real life supply and demand for the stock over time — and examines that data in different ways. One of those ways is to calculate a Simpe Moving Average ("SMA") by looking back a certain number of days. One of the most popular "longer look-backs" is the OKE 200 day moving average ("OKE 200 DMA"), while one of the most popular "shorter look-backs" is the OKE 50 day moving average ("OKE 50 DMA"). A chart showing both of these popular moving averages is shown on this page for ONEOK. Comparing two moving averages against each other can be a useful visualization tool: by calculating the difference between the OKE 200 DMA and the OKE 50 DMA, we get a moving average convergence divergence indicator ("OKE MACD"). The OKE MACD chart, in conjunction with the chart of the moving averages, basically helps in visualizing how the moving averages are showing convergence (moving closer together), or divergence (moving farther apart). |